
Figures & data
Table 1. Endophytic fungal strains and their TLC screening results.
Figure 1. Morphological characteristics of strain TW5: colony on a PDA plate (a); microscopic examination of the structures of mature sporangium and sporangiophore (200×) (b); and the shape of the sporangiospore (400×) (c).
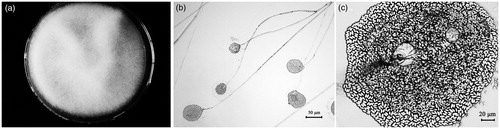
Figure 2. Neighbor-joining trees based on the partial ribosomal gene sequences of strain TW5 and its closest relatives. The scale bar indicates a 2% estimated difference in the nucleotide sequence. GenBank accession numbers are shown in parentheses.
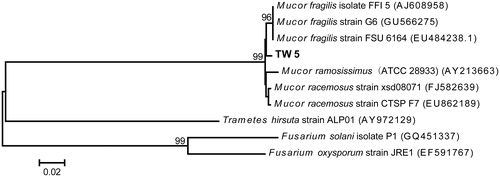
Figure 3. Growth curve of M. fragilis (strain TW5). The error bars represent the standard deviations from the mean value of three flasks.
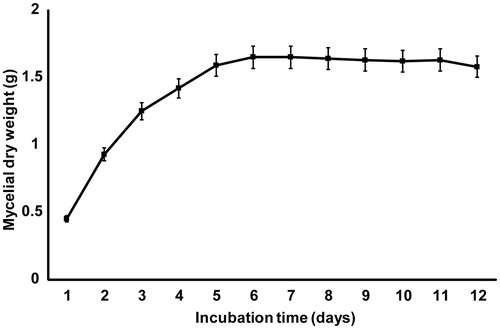
Figure 4. HPLC chromatograms of standard podophyllotoxin (a), fungal podophyllotoxin (b), standard kaempferol (c), and fungal kaempferol (d).
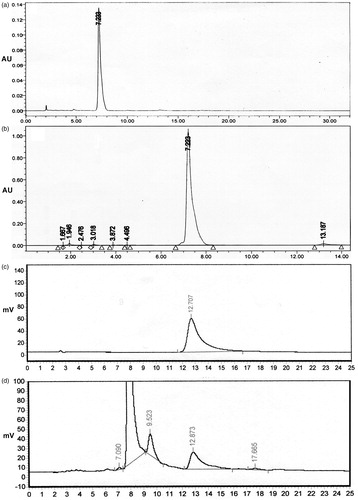
Figure 5. Chemical structures of podophyllotoxin (a) and kaempferol (b). Numbers represent the carbon positions.
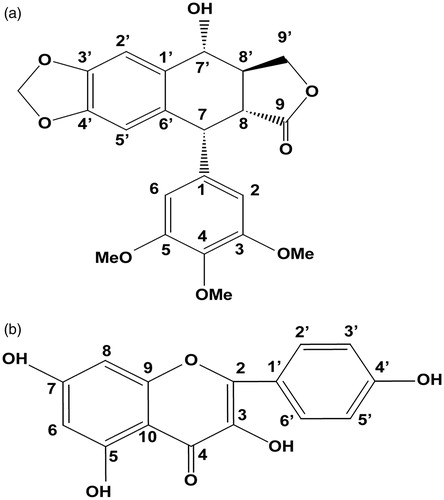
Table 2. 1H- and 13C-NMR characterization of fungal podophyllotoxin.
Table 3. 1H- and 13C-NMR characterization of fungal kaempferol.