Figures & data
Figure 1. Changes in rat body weight with the duration of subchronic treatment. Each point represents mean ± SD.
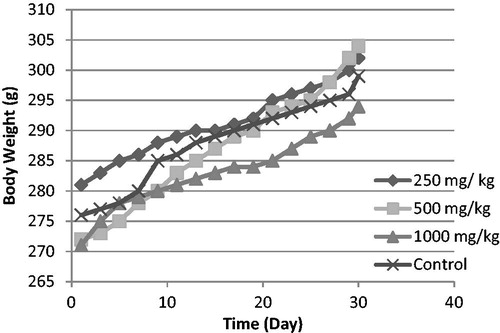
Figure 2. Changes in food consumption with the duration of subchronic treatment. Each point represents mean ± SD.
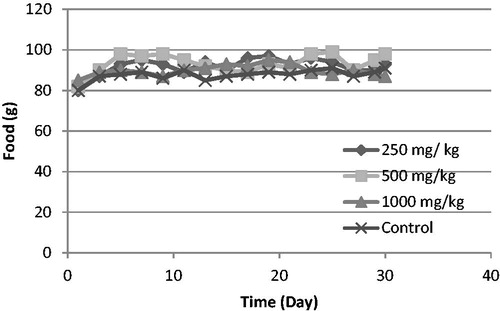
Table 1. Relative organ weight (ROW) at end of treatment with Ferulago carduchorum (g% body weight).
Table 2. Hematologic parameters in Wistar rats after 30 d treatment with Ferulago carduchorum.
Table 3. Biochemical parameters of Wistar rats after 30 d treatment with Ferulago carduchorum.
Figure 3. Histopathological picture of liver of control and treated groups of animals. (A) The section of liver from control animals showed normal liver architecture composed of normal sinusoidal pattern and normal hepatocytes; (B), (C), and (D) The section of liver from rats treated with Ferulago carduchorum 250, 500, and 1000 mg/kg body weight exhibited normal architecture of hepatocytes indicating no toxicity of the extract (40× magnification).
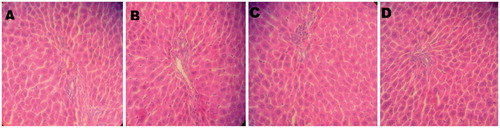
Figure 4. Histopathological picture of kidney of control and treated groups of animals. (A) The section of kidney from control animals revealed normal sizes of glomeruli with normal tubules; (B), (C) and (D) The section of kidney from rats treated with Ferulago carduchorum 250, 500, and 1000 mg/kg body weight showed the normal sizes of glomeruli with normal tubules indicating safety of the extract (20× magnification).
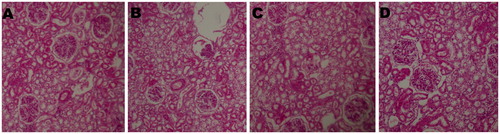
Figure 5. Structures of the isolated coumarins from Ferulago carduchorum.
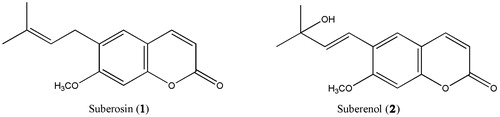
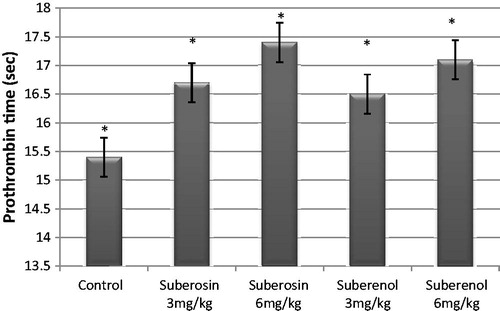
Figure 6. Anticoagulant activity of isolated coumarins from Ferulago carduchorum. *p < 0.05 versus control group.