Figures & data
Table 1. Effects of different doses of O. vulgare pretreatment on the serum levels of hepatic markers after CP administration.
Figure 1. Normal group; a liver section of a mouse showing the normal histological structure of a hepatocyte (A; yellow arrow), sinusoidal space (B; red arrow), and central vein (C; white arrow).
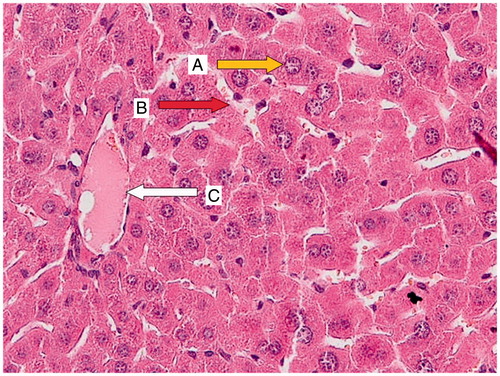
Figure 2. CP group (200 mg/kg); a liver section of a mouse showing necrotic hepatocytes with small crushed nuclei (A; yellow arrow), a portal space with severe inflammation (B; blue arrow), and hepatocytes surrounded by lymphocytic infiltration (C; green arrow).
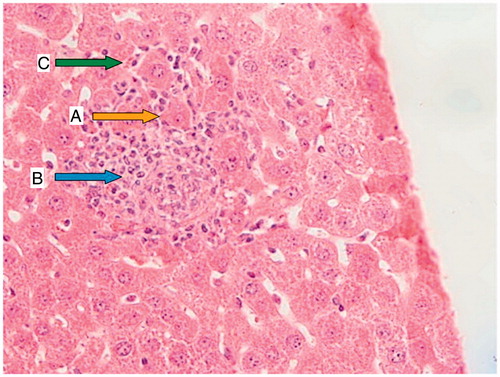
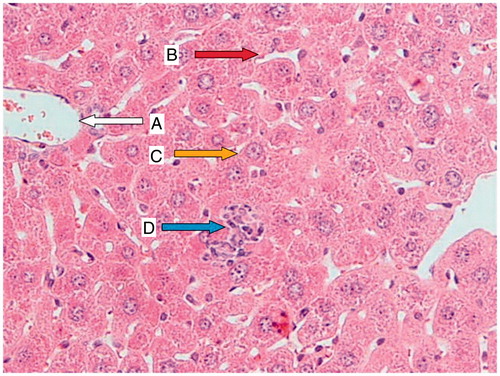
Figure 3. Origanum vulgare-pretreated animals (400 mg/kg) for 7 d before CP administration; a liver section of a mouse showing a normal central vein (A; white arrow), normal sinusoidal space (B; red arrow), nearly normal hepatocyte (C; yellow arrow), and small portal space with mild lymphocytic infiltration (D; blue arrow).