Figures & data
Figure 1. Scheme for the fractionation of Delonix elata methanol extract.
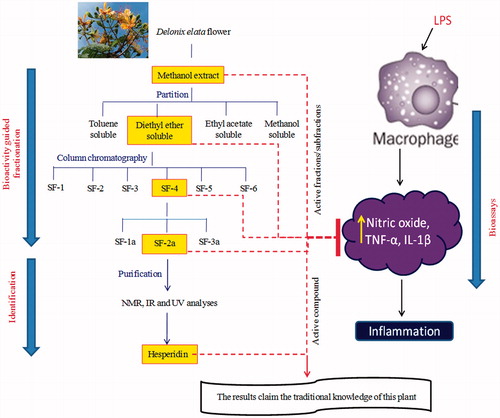
Figure 2. Effect of Delonix elata flower methanol extract on LPS-induced RAW 264.7 cell line. (a) NO; (b) TNF-α and IL-1β; levels of LPS-induced RAW 264.7 cell lines. Values are mean ± SEM for triplicate independent experiments; values carrying the same alphabet did not vary significantly from each other (Tukey’s HSD; p ≤ 0.05).
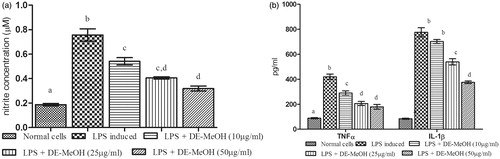
Table 1. Effect of toluene (TO), diethylether (ET), ethyl acetate (EA), and methanol (MeOH) soluble fractions of Delonix elata flower methanol extract on LPS-induced RAW 264.7 cell line.
Table 2. Effect of sub-fractions from the diethylether soluble fractions of Delonix elata flower methanol extract on LPS-induced RAW 264.7 cell line.
Table 3. Effect of sub-fractions from SF-4 of the diethylether soluble fractions of Delonix elata flower methanol extract on LPS-induced RAW 264.7 cell line.
Figure 3. Effect of active compound (hesperidin) isolated from Delonix elata flowers on LPS-induced RAW 264.7 cell line. (a) NO; (b) TNF-α and IL-1β; levels of LPS-induced RAW 264.7 cell lines. Values are mean ± SEM for triplicate individual experiments; values carrying the same alphabet did not vary significantly from each other (Tukey’s HSD; p ≤ 0.05).
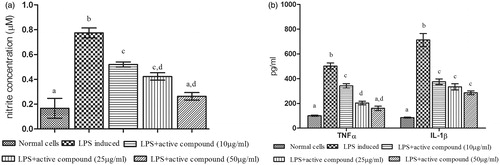
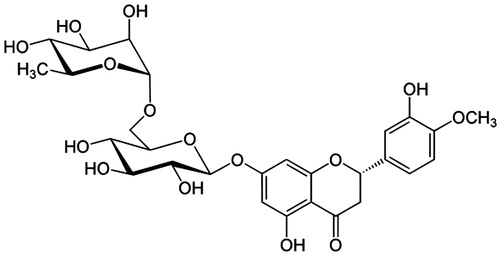
Figure 5. The structure of hesperidin.