Figures & data
Table 1. Antibiotic resistance profile of clinically isolated bacterial strains used.
Table 2. MIC values (μg/mL) of aminoglycosides in the absence and presence of 64 μg/mL EEMp.
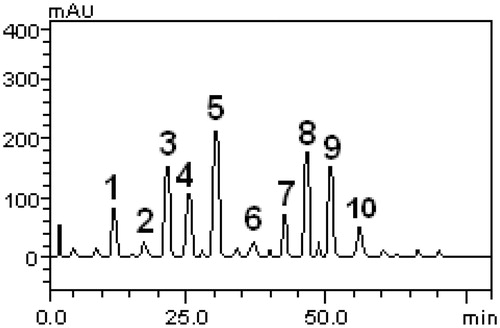
Figure 1. High performance liquid chromatography showing phenolic and flavonoid profile of Murraya paniculata. Gallic acid (peak 1), catechin (peak 2), chlorogenic acid (peak 3), caffeic acid (peak 4), ellagic acid (peak 5), epicatechin (peak 6), rutin (peak 7), quercitrin (peak 8), quercetin (peak 9), and kaempferol (peak 10).