Figures & data
Figure 1. Chromatograms of schizandrin (A) and the SC extract (B) obtained at an UV wavelength of 250 nm.
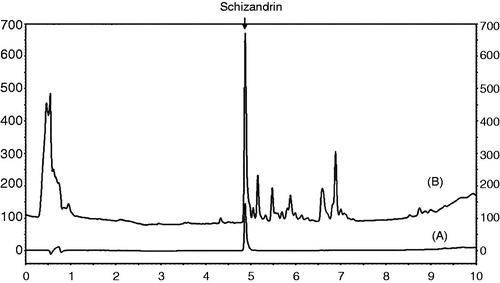
Figure 2. Induction of apoptosis in AGS cells by SCE in vitro. (A) AGS cells were cultured in the presence of SCE at the indicated concentrations for 24 or 72 h. Cell viabilities were determined by MTT assay. Viabilities of cells significantly decreased in a dose- and time-dependent manner. The number of viable cells after SCE treatment is expressed as a percentage of untreated cells. (B) Sub-G1 fractions are expressed as percentages of untreated cells. Cells were treated with the indicated concentrations of SCE for 72 h. (C) Mitochondria membrane depolarization is expressed as percentages of untreated cells. Cells were treated with the indicated concentrations of SCE for 72 h. Paclitaxel was used as a positive control. Values are means ± SEMs. *p < 0.05, **p < 0.01 compared with CTRL. CTRL, untreated AGS cells.
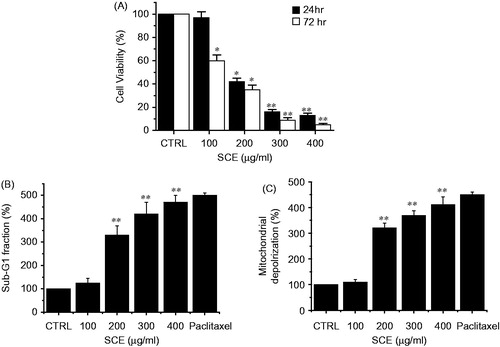
Figure 3. Down-regulation of the expression level of Bcl-2, and the up-regulation of Bax, Fas/FasL, pro-apoptotic genes, and caspase-9 and -3 activities in AGS cells. (A) Western blot analysis was performed using AGS cells treated with different SCE concentrations for 24 h. Bcl-2 expression was markedly down-regulated by SCE, whereas Bax expression was up-regulated. (B) RT-PCR was performed using AGS cells treated with different SCE concentration for 24 h. Fas and FasL were up-regulated by SCE. (C) Cells were cultured with SCE at the indicated concentrations for 72 h prior to caspase assays. The caspase activity of untreated cells was taken to be 100%. Pan-caspase inhibitor, zVAD-fmk, (zVAD) at 20 µM was treated to validate the analytical method. Values are means ± SEMs. **p < 0.01. ß-Actin was used as a loading control. CTRL, untreated AGS cells.
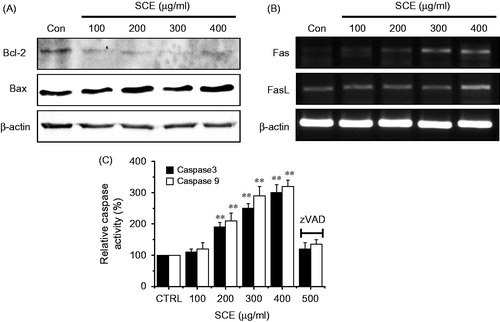
Figure 4. The effect of SCE on the MAPK-signaling pathway in AGS cells. MTT assays were used to determine cell viabilities in the presence of (A) JNK II inhibitor or (B) SB203580 (a p38 MAPK inhibitor). Cells were treated with the indicated concentrations of SCE with JNK II inhibitor or SB203580 (both at 10 µM) for 72 h. (C) RT-PCR was performed using AGS cells treated with zVAD, JNK, or p38 inhibitor. Fas were decreased by zVAD, JNK, or p38 inhibitor. (D) Western blot analysis was performed using AGS cells treated with zVAD, JNK, or p38 inhibitor. Bcl-2 expression was markedly increased by zVAD, JNK, or p38 inhibitor. Values are means ± SEMs. *p < 0.01, **p < 0.01, #p < 0.01 compared with the CRTL. #p < 0.05 compared with each. CTRL: untreated AGS cells.
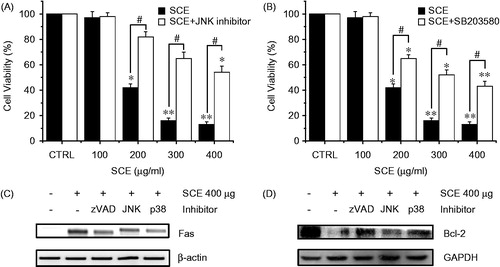
Figure 5. SCE enhanced ROS accumulation in AGS cells. (A) Intracellular ROS was detected in AGS cells after treatment with the indicated concentration of SCE for 24 h. ROS production is expressed as percentages of untreated cells. (B) Cells were treated with SCE and NAC for 24 h and cell viabilities were determined by MTT assay. Values are means ± SEMs. *p < 0.05, **p < 0.01 versus CRTL. #p < 0.05 compared with each. CTRL, untreated AGS cells.
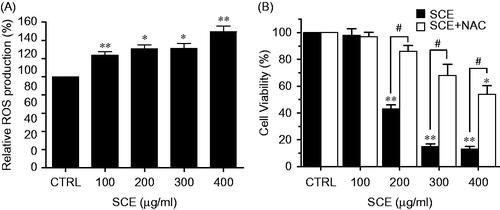
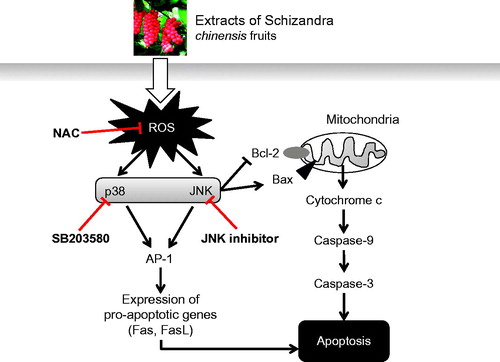
Figure 6. Hypothetical schematic signaling pathway of SCE-induced apoptosis in AGS cells. SCE promotes pro-apoptotic factor Bax protein expression and decreases anti-apoptotic factor Bcl-2 protein expression and these are followed by cytochrome c release into the cytosol. Cytochrome c can activate the caspase-9 cascade followed by the caspase-3 cascade, which leads to cell death via the intrinsic apoptotic pathway. Another possible pathway is the extrinsic apoptotic pathway, which acts through ROS-mediated JNK/p38 MAPK. The Fas/FasL system (a pro-apoptotic system) is provoked by AP-1.