Figures & data
Figure 1. Effect of citral on cytotoxic activity of doxorubicin against Ramos cells. The cells were treated with doxorubicin (0–3 µM) alone or in combination with citral at 10, 20, and 40 µM for 24 h. Cytotoxicity was determined by the resazurin reduction assay. The data represent means ± SEM of three independent experiments. *p < 0.05 compared with doxorubicin alone.
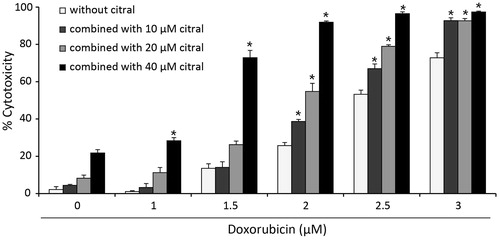
Figure 2. Effect of citral on cytotoxic activity of doxorubicin against human PBMCs. The cells were treated with doxorubicin (1.5, 2, and 2.5 µM) alone or combined with citral at 10, 20, and 40 µM for 24 h. Cytotoxicity was determined by the resazurin assay. The data are expressed as means ± SEM of five independent experiments. *p < 0.05 compared with the solvent control.
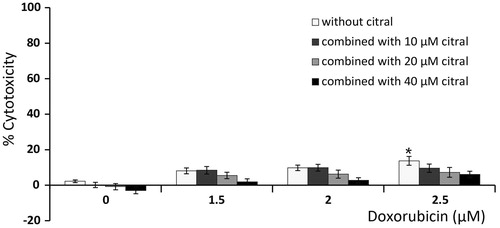
Table 1. IC50 and combination index (CI) values of doxorubicin combined with citral at 10, 20, and 40 µM on Ramos cells after 24 h incubation.
Figure 3. Effect of citral on doxorubicin-induced Ramos cell death. The cells were treated with doxorubicin (1.5, 2, and 2.5 µM) alone or combined with citral at 10, 20, and 40 µM for 18 h. Treated cells were stained with annexin V-FITC/DAPI and analyzed by flow cytometry. Types of Ramos cell death were assessed as follows; annexin V-FITC+ cells were apoptotic cells, DAPI+ cells were necrotic cells, and annexin V-FITC+/DAPI+ cells were late apoptotic cells. The percentage of total cell death (apoptosis, late apoptosis, and necrosis) was plotted. The data represent means ± SEM of three independent experiments. *p < 0.05 compared with doxorubicin alone.
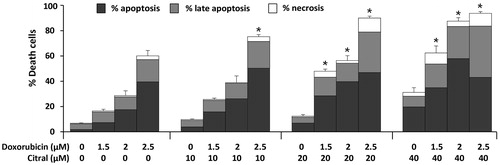
Figure 4. Effect of citral on the expression of BAX, BAK, BCL-XL, and BCL-2 in Ramos cells treated with doxorubicin (1.5 µM) alone or combined with citral at 20 and 40 µM for 18 h. The total RNA from the treated cells was reverse transcribed to cDNA for amplification of the mRNA expression levels of these genes by quantitative RT-PCR. GAPDH was used as the endogenous gene control for normalization. The expression levels of these genes from 0.5% ethanol-treated Ramos cells were regarded to have RQ = 1. The data are expressed as means ± SEM of four independent experiments. *p < 0.05 compared with solvent control, #p < 0.05 compared with doxorubicin alone, †p < 0.05 compared with 40 µM citral alone.
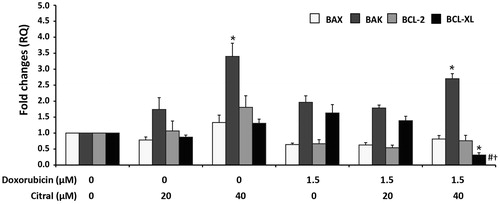
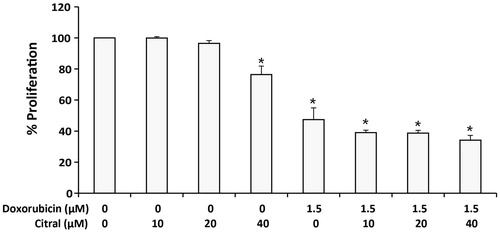
Figure 5. Effect of citral on the anti-proliferative effect of doxorubicin against Ramos cells. The cells were treated with doxorubicin (1.5 µM) alone or combined with citral at 10, 20, and 40 µM for 3 h. Treated cells were then washed and incubated in fresh medium without doxorubicin and citral for another 48 h. Numbers of the cells were counted by Scepter™ Handheld Automated Cell Counter. The results were expressed as a percentage of cells compared with 0.5% ethanol-treated Ramos cells (100% cell proliferation). The data are expressed as means ± SEM of three independent experiments. *p < 0.05 compared with solvent control.