Figures & data
Table 1. Criteria for scoring macroscopic and microscopic colonic damage.
Figure 1. Histological images of colon tissues obtained from control and experimental groups. Microscopic evaluation of the control group showed intense transmural inflammation and/or diffuse necrosis (A) and severe crypt destruction (B). In histological examination of the dexamethasone group, minimal mucosal inflammation was observed (C). In the TG-20 group, almost complete necrosis of crypts (D) and severe inflammation of mucosa and submucosa were observed (E). In the TG-30 group, diffuse destruction of crypts was observed (F). In the TG-50 group, no necrosis in crypt (G) and mild inflammation of mucosa (H) were observed.
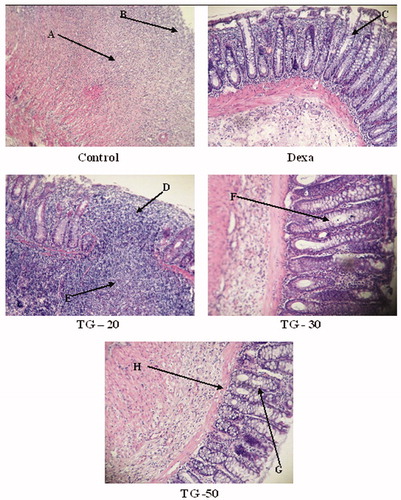
Table 2. Macroscopic and microscopic scores as criteria for assessing colonic damage.
Figure 2. Tumor necrosis factor-alpha (TNF-α) level in colon. Values are mean ± SEM. Dexa, dexamethasone; TG20, T. graminifolius at dose of 20 mg/kg; TG30, T. graminifolius at dose of 30 mg/kg; TG50, T. graminifolius at dose of 50 mg/kg. aSignificantly different from the Normal group at p < 0.05. bSignificantly different from the control group at p < 0.05. cSignificantly different from the Dexa group at p < 0.05. aaSignificantly different from the Normal group at p < 0.01. bbSignificantly different from the control group at p < 0.01. ccSignificantly different from the Dexa group at p < 0.01. aaaSignificantly different from the Normal group at p < 0.001. bbbSignificantly different from the control group at p < 0.001. cccSignificantly different from the Dexa group at p < 0.001.
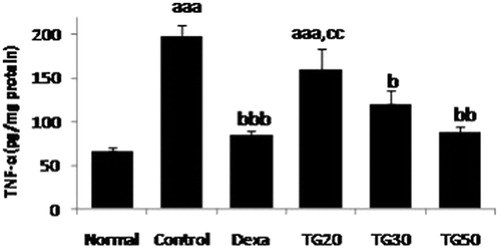
Figure 3. Interleukin 1-beta (IL-1β) level in colon. Values are mean ± SEM. Dexa, dexamethasone; TG20, T. graminifolius at dose of 20 mg/kg; TG30, T. graminifolius at dose of 30 mg/kg; TG50, T. graminifolius at dose of 50 mg/kg. aSignificantly different from the Normal group at p < 0.05. bSignificantly different from the control group at p < 0.05. cSignificantly different from the Dexa group at p < 0.05. aaSignificantly different from the Normal group at p < 0.01. bbSignificantly different from the control group at p < 0.01. ccSignificantly different from the Dexa group at p < 0.01. aaaSignificantly different from the Normal group at p < 0.001. bbbSignificantly different from the control group at p < 0.001. cccSignificantly different from the Dexa group at p < 0.001.
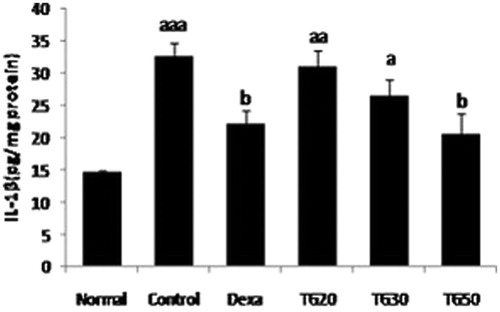
Figure 4. Total antioxidant power as ferric-reducing antioxidant power (FRAP) level in colon. Values are mean ± SEM. Dexa, dexamethasone; TG20, T. graminifolius at dose of 20 mg/kg; TG30, T. graminifolius at dose of 30 mg/kg; TG50, T. graminifolius at dose of 50 mg/kg. aSignificantly different from the Normal group at p < 0.05. bSignificantly different from the control group at p < 0.05. cSignificantly different from the Dexa group at p < 0.05. aaSignificantly different from the Normal group at p < 0.01. bbSignificantly different from the control group at p < 0.01. ccSignificantly different from the Dexa group at p < 0.01. aaaSignificantly different from the Normal group at p < 0.001. bbbSignificantly different from the control group at p < 0.001. cccSignificantly different from the Dexa group at p < 0.001.
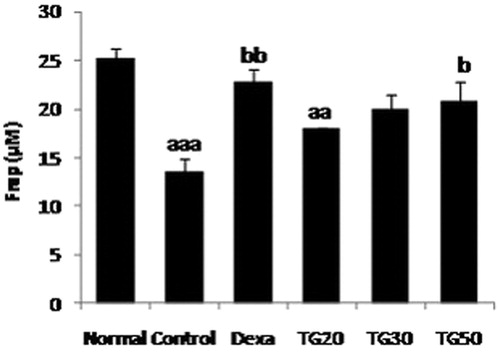
Figure 5. Lipid peroxidation (LPO) levels as thiobarbituric acid reacting substances (TBARS) in colon. Values are mean ± SEM. Dexa, dexamethasone; TG20, T. graminifolius at dose of 20 mg/kg; TG30, T. graminifolius at dose of 30 mg/kg; TG50, T. graminifolius at dose of 50 mg/kg. aSignificantly different from the Normal group at p < 0.05. bSignificantly different from the control group at p < 0.05. cSignificantly different from the Dexa group at p < 0.05. aaSignificantly different from the Normal group at p < 0.01. bbSignificantly different from the control group at p < 0.01. ccSignificantly different from the Dexa group at p < 0.01. aaaSignificantly different from the Normal group at p < 0.001. bbbSignificantly different from the control group at p < 0.001. cccSignificantly different from the Dexa group at p < 0.001.
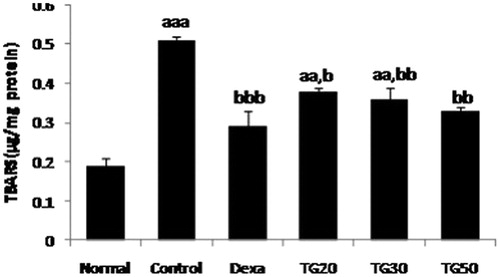
Figure 6. Myeloperoxidase activity (MPO) in colon. Values are mean ± SEM. Dexa, dexamethasone; TG20, T. graminifolius at dose of 20 mg/kg; TG30, T. graminifolius at dose of 30 mg/kg; TG50, T. graminifolius at dose of 50 mg/kg. aSignificantly different from the Normal group at p < 0.05. bSignificantly different from the control group at p < 0.05. cSignificantly different from the Dexa group at p < 0.05. aa Significantly different from the Normal group at p < 0.01. bbSignificantly different from the control group at p < 0.01. ccSignificantly different from the Dexa group at p < 0.01. aaaSignificantly different from the Normal group at p < 0.001. bbbSignificantly different from the control group at p < 0.001. cccSignificantly different from the Dexa group at p < 0.001.
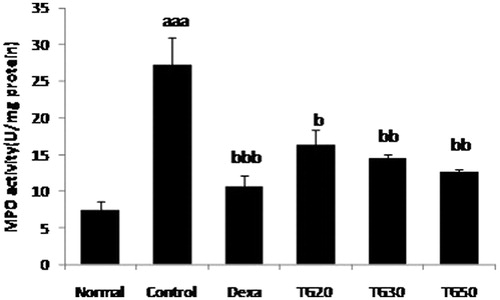
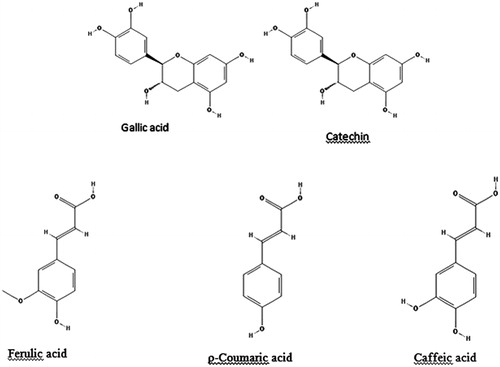
Figure 7. Chemical structures of the phenolic compounds that are quantified by HPLC for standardization of the extract from T. graminifolius.