Figures & data
Figure 1. (A )HPTLC chromatogram of quercetin. (B) HPTLC chromatogram of methanol extract of C. arborea.
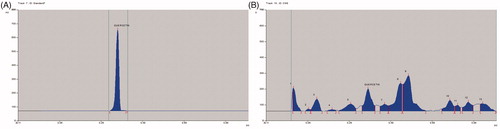
Figure 2. (A) HPTLC chromatogram of betulinic acid. (B) HPTLC chromatogram of methanol extract of C. arborea.
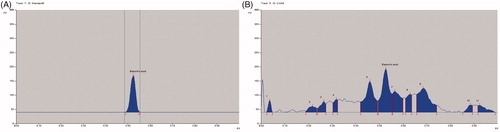
Figure 3. Effect of CAME on paw volume in carrageenan-induced inflammed rats. Each value is mean ± SEM (n = 6). ***p < 0.001 when compared with untreated carrageenan control.
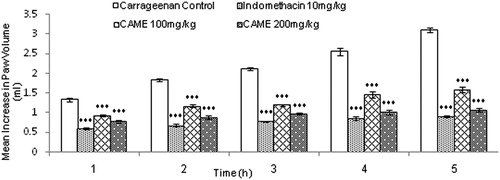
Figure 4. Photomicrograph of left hind paw tissue section stained by H & E. (A) Photomicrograph of paw tissue section from normal control rat. (B) Photomicrograph of paw tissue section from carrageenan control rat. (C) Photomicrograph of paw tissue section from indomethacin (10 mg/kg) treated rat. (D) Photomicrograph of paw tissue section from CAME (100 mg/kg) treated rat. (E) Photomicrograph of paw tissue section from CAME (200 mg/kg) treated rat (magnification: 400×; scale bar: 20 µm).
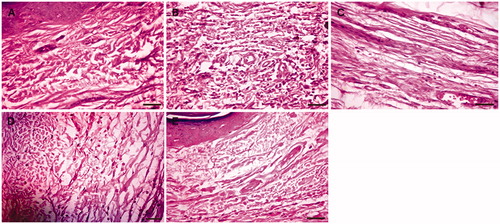
Figure 5. Effect of CAME on plasma malondialdehyde and C-reactive protein levels of inflamed rats. (A) Malondialdehyde (MDA) level in the plasma. (B) C-reactive protein (CRP) level in the plasma. Each value is mean ± SEM (n = 6) §p < 0.05, §§p < 0.01, and §§§p < 0.001, a = non-significant when compared with normal control. *p < 0.05, **p < 0.01, and ***p < 0.001, b=non-significant when compared with untreated carrageenan control.
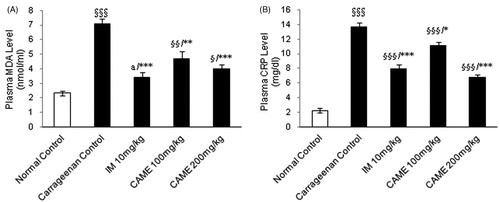
Figure 6. Effect of CAME (100 and 200 mg/kg) on nitric oxide and myeloperoxidase levels of inflamed rats paw tissue. (A) Nitric oxide (NO) level in the paw tissue homogenate. (B) Myeloperoxidase (MPO) level in the paw tissue homogenate. Each value is mean ± SEM (n = 6). §p < 0.05, §§p < 0.01, and §§§p < 0.001, a = non-significant when compared with normal control. *p < 0.05, **p < 0.01, and ***p < 0.001 when compared with untreated carrageenan control.
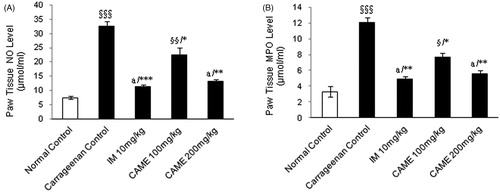
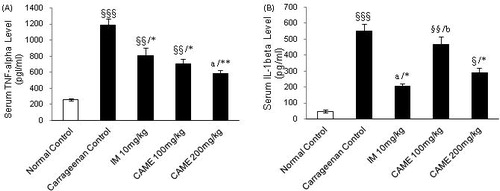
Figure 7. Effect of CAME (100 and 200 mg/kg) on serum pro-inflammatory cytokines (TNF-α and IL-1β) of inflamed rats. (A) TNF-α level in the serum. (B) IL-1β level in the serum. Each value is mean ± SEM (n = 6). §p < 0.05, §§p < 0.01, and §§§p < 0.001, a = non-significant when compared with normal control. *p < 0.05 and **p < 0.01, b = non-significant when compared with untreated carrageenan control.