Figures & data
Table 1. Zetasizer measurements and the association efficiency considering the different loading (%) of RA, sage, and savory nanoparticles (n = 3).
Figure 1. SEM micrographs of freeze-dried sage (a), savory-nanoparticles (b) both at 50% theoretical loading; and RA-nanoparticles (c), at 40% theoretical loading.
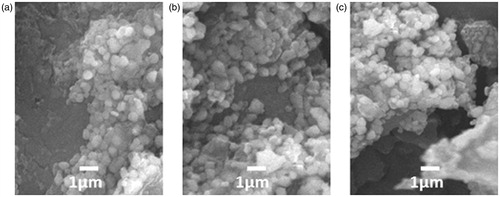
Table 2. Association efficiency, theoretical loading, and final RA content in CS nanoparticles.
Table 3. Peak temperatures in the DSC thermograms collected from CS, RA, sage and savory, physical mixtures, and nanoparticles.
Figure 2. I. Thermogram of CS empty nanoparticles (a); thermogram of free RA (b); thermogram of RA and CS physical mixture (mixing ratio 1:1) (c); thermogram of RA encapsulated in CS nanoparticles (at a theoretical 40% loading) (d). II. Thermogram of CS empty nanoparticles (a); thermogram of free sage (b); thermogram of sage and CS physical mixture (mixing ratio 1:1) (c); thermogram of sage encapsulated in CS nanoparticles (at a theoretical 50% loading) (d). III. Thermogram of CS empty nanoparticles (a); thermogram of free savouy (b); thermogram of savory and CS physical mixture (mixing ratio 1:1) (c); thermogram of savory encapsulated in CS nanoparticles (at a theoretical 50% loading) (d).
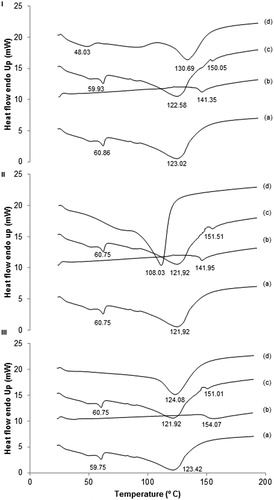
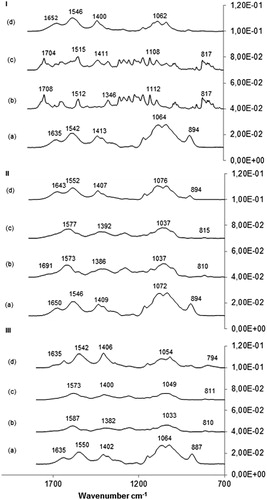
Figure 3. I. Spectrum of CS empty nanoparticles (a); spectrum of RA in a free form (b); spectrum of physical mixture between CS-unloaded nanoparticles and RA (mixing ratio 1:1) (c); spectrum of RA encapsulation into CS nanoparticles (d). II. Spectrum of CS empty nanoparticles (a); spectrum of sage in a free form (b); spectrum of physical mixture between CS unloaded nanoparticles and sage (mixing ratio 1:1) (c); spectrum of sage encapsulation into CS nanoparticles (d). III. Spectrum of CS empty nanoparticles (a); spectrum of savory in a free form (b); spectrum of physical mixture between CS-unloaded nanoparticles and savory (mixing ratio 1:1) (c); spectrum of savory encapsulation into CS nanoparticles (d).