Figures & data
Figure 1. Bioassay-guided extraction and fractionation of T. patula flower.
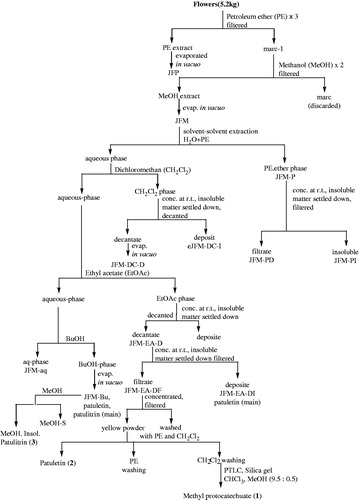
Figure 2. Chemical structure of pure compounds of T. patula flower.
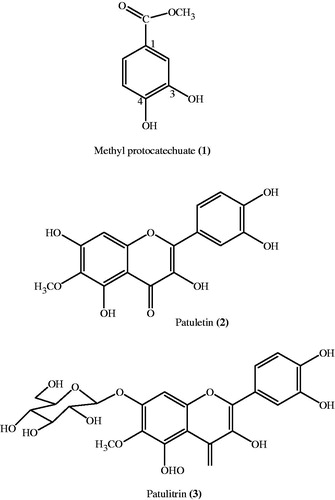
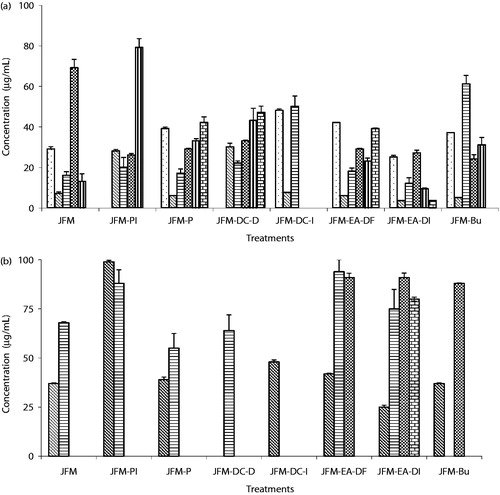
Figure 3. The bar graph represents concentrations values of (a) GI50 (50% cell growth inhibition) and (b) LC50 (50% cell kill) of T. patula methanol extract (JFM) and its fractions (JFM-PI, JFM-P, JFM-DC-D, JFM-DC-I, JFM-EA-DF, JFM-EA-DI, and JFM-Bu) against PC-3 (![]()