Figures & data
Figure 1. The chemical structure of portulacerebroside A (PCA).
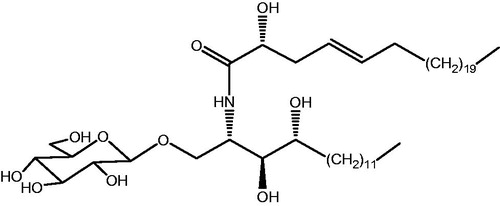
Table 1. Primers used in FQ-RT-PCR analysis.
Figure 2. Effects of portulacerebroside A on adhesive ability of HCCLM3 cells. The cells were pre-treated with various concentrations of portulacerebroside A (PCA) for 12 h in a 96-well plate and the adhesion rate of the cells was determined at 0.5 h, 1 h, and 1.5 h. **,ΔΔ, ††p < 0.01 compared with the control group. Data are expressed as the mean ± SD, n = 6.
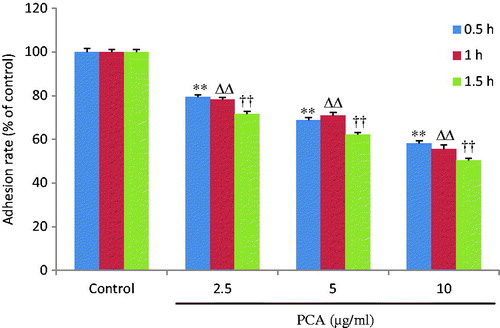
Figure 3. Effects of portulacerebroside A on invasive ability of HCCLM3 cells. After 6 h of pretreatment with designated concentrations of portulacerebroside A (PCA), the cells were incubated in transwell cabinets for a further 24 h, and the invasive cell number (A) was counted. (B) Representative images (×20) for each group. **p < 0.01 compared with the control group. Data are expressed as the mean ± SD, n = 6.
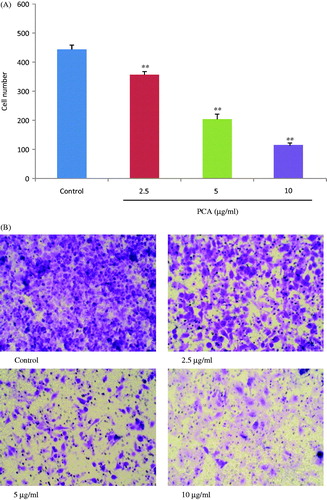
Figure 4. Effects of portulacerebroside A on migration ability of HCCLM3 cells. The cells were subjected to a cross line wound by a sterile pipette tip in a 6-well plate and were then incubated with designated concentrations of portulacerebroside A (PCA) for 24 h and 48 h. The migration cells were then counted (A). (B) and (C) display typical images (×10) of cells treated with PCA. **ΔΔp < 0.01 compared with the control group. Data are expressed as the mean ± SD. n = 6.
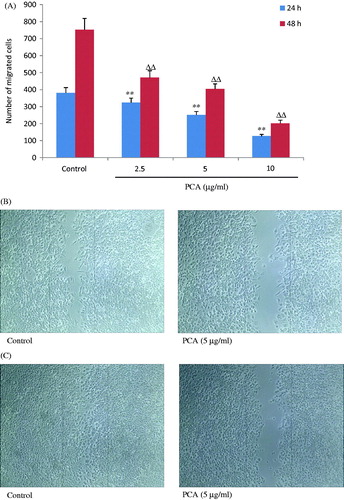
Table 2. Effects of PCA on the mRNA expression of metastasis-related parameters.
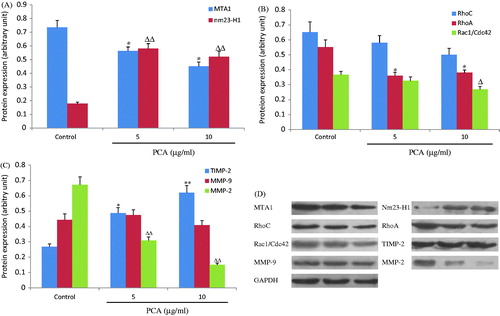
Figure 5. Effects of portulacerebroside A on the protein expression of metastasis-related parameters. After 24 h of treatment with portulacerebroside A (PCA), the protein expression of MTA1 (A), nm23-H1 (A), RhoC (B), RhoA (B), Rac1/Cdc42 (B), MMP-2 (C), MMP-9 (C), and TIMP-2 (C) was detected by western blot. (D) Representative western blot images of HCCLM3 cells treated with PCA. *, Δ p < 0.05; **, ΔΔ p < 0.01 compared with the control group. Data are expressed as the mean ± SD, n = 3.