Figures & data
Figure 1. Experimental design scheme.
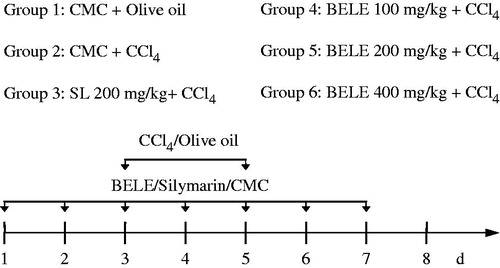
Figure 2. Effects of BELE on the serum ALT (a), AST (b), ALP (c), TBIL (d), ALB (e), GLB (f), and TP (g). ##p < 0.01, ###p < 0.001 versus the vehicle-control group (control); *p < 0.05, **p < 0.01, and ***p < 0.001 versus vehicle with the CCl4 group (model).
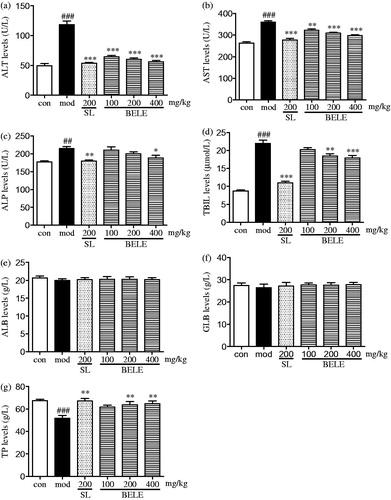
Figure 3. Effects of BELE on the hepatic SOD (a) content and MDA (b) activity. ###p < 0.001 versus the vehicle-control group (control); *p < 0.05, **p < 0.01, and ***p < 0.001 versus vehicle with the CCl4 group (model).
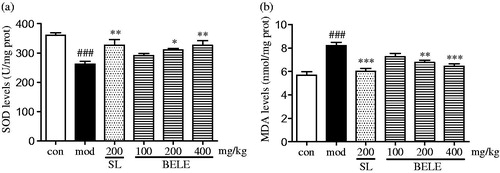
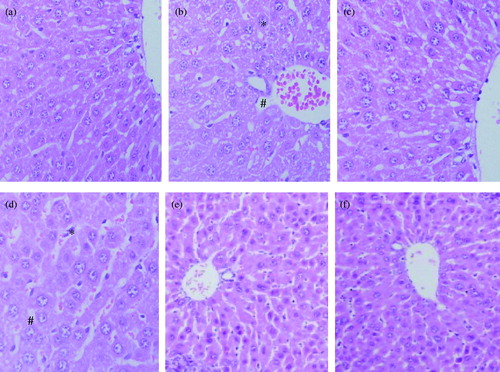
Figure 4. Effects of BELE on hepatic morphological analysis (× 400 H&E): control group (a), CCl4-model group (b), Silymarin + CCl4 group (c), BELE 100 mg/kg + CCl4 group (d), BELE 200 mg/kg + CCl4 group (e), and BELE 400 mg/kg + CCl4 group (f) (*inflammatory infiltration; #dilated sinusoidal spaces).