Figures & data
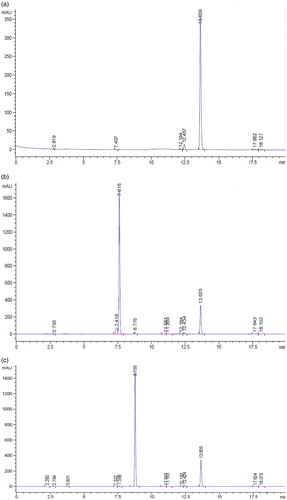
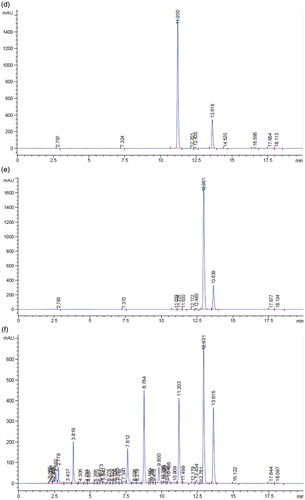
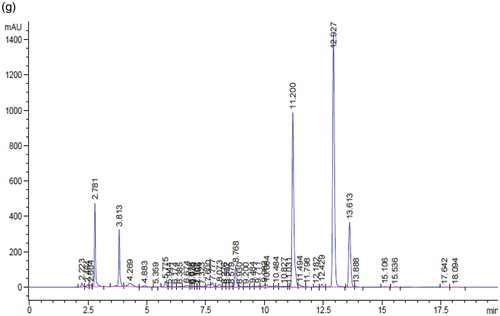
Figure 2. Quantitative analysis of daidzin, genistin, daidzein, and genistein in soy and tempeh extracts. The value represented mean ± SD (n = 3). *p < 0.001 as compared with soybean.
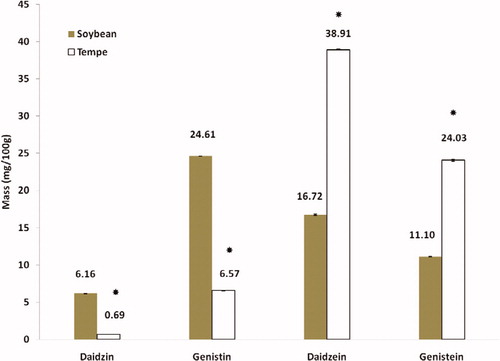
Figure 3. DPPH radical scavenging activity (%) of gallic acid, soy, and tempeh extracts. The values represent mean ± SD (n = 3). The IC50 values of gallic acid, soybean, and tempeh were 0.065 mg/ml, 10 mg/ml, and 2.67 mg/ml, respectively.
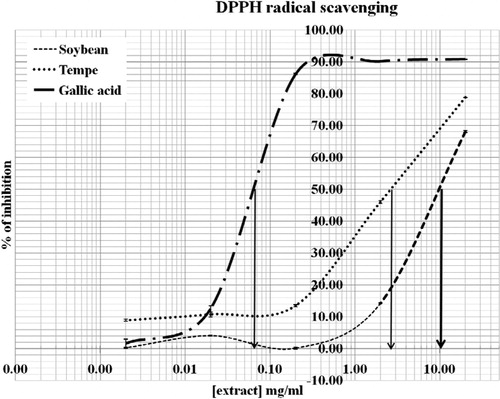
Figure 4. Ferrous ion chelating ability (%) of gallic acid, soy, and tempeh extracts. The values represent mean ± SD (n = 3). The IC50 values of gallic acid, soybean, and tempeh were 1.50 mg/ml, 11.13 mg/ml, and 10.40 mg/ml respectively.
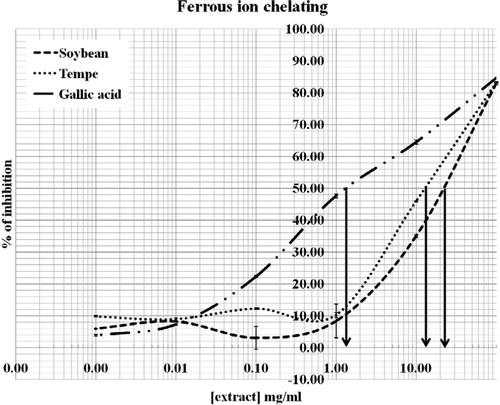
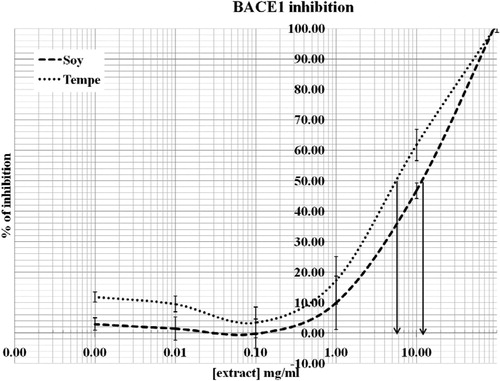
Figure 5. BACE1 inhibition activity of soybean and tempeh extracts. The values represent mean ± SD. The IC50 values of soybean and tempeh were 10.87 mg/ml and 5.47 mg/ml, respectively.