Figures & data
Figure 1. GC Chromatogram of Salvia lavandulifolia essential oil.
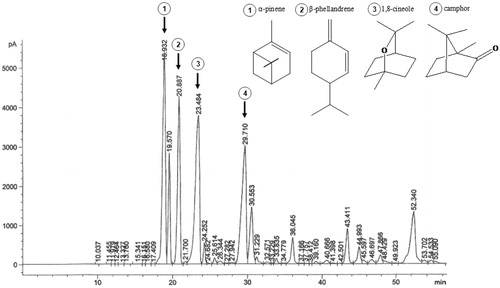
Figure 2. (A) Effect of monoterpenes on cell viability. U373-MG cells were treated with α-pinene and 1,8-cineole (a range of concentrations from 10 to 400 μM) for 24 h. Cell viability was measured using MTT assay. Experiments were performed in triplicate and results are expressed as mean ± S.D. *p < 0.05 versus control. (B) Cytoprotective effect of monoterpenes. U373-MG cells were pretreated with α-pinene and 1,8-cineole (a range of concentrations from 10 to 100 μM) for 24 h, previous to the treatment with H2O2 (1 mM) for 30 min. Cell viability was measured using the MTT assay. Experiments were performed in triplicate and results are expressed as mean ± S.D. *p < 0.05 versus control, # p < 0.05 versus H2O2-treated cells. (C) Effect of monoterpenes on cell morphology. U373-MG cells were pretreated with α-pinene and 1,8-cineole (10 and 25 μM) for 24 h, previous to the treatment with H2O2 (1 mM) for 30 min. Representative images are shown.
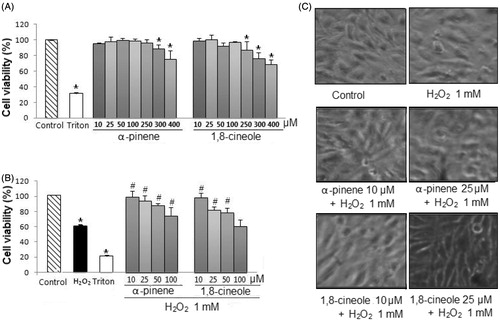
Table 1. Chemical composition of the essential oil of S. lavandulifolia.
Table 2. (A) Antiradical activity measured using the oxygen radical absorbance (ORAC) method. (B) Effect of monoterpenes on lipid peroxidation.
Figure 3. Effect of monoterpenes on intracellular ROS production. U373-MG cells were pretreated with α-pinene and 1,8-cineole (10 and 25 μM) for 24 h, previous to the treatment with H2O2 (1 mM) for 30 min. The intracellular ROS production was measured using the dichlorofluorescein assay. Data are expressed as percentage of ROS production, mean ± SD, #p < 0.05, versus H2O2-treated cells.
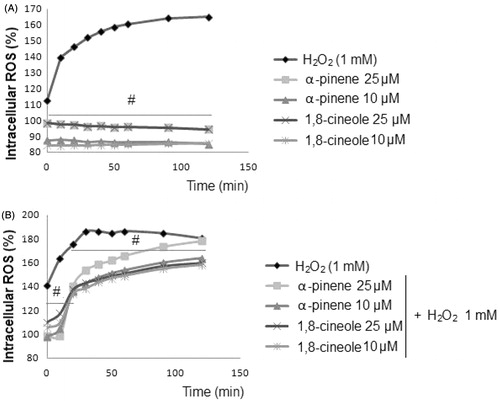
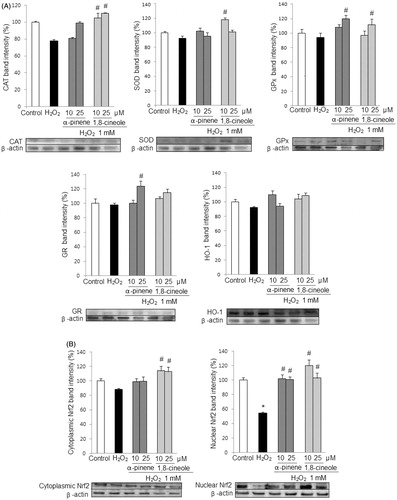
Figure 4. (A) Effect of monoterpenes on protein expression of antioxidant enzymes. U373-MG cells were pretreated with α-pinene and 1,8-cineole (10 and 25 μM) for 24 h, previous to the treatment with H2O2 (1 mM) for 30 min. The levels of protein expression of CAT, SOD, GR, GPx, and HO-1 were measured by Western blots. (B) Effect of monoterpenes on Nrf2 protein expression. U373-MG cells were pretreated with α-pinene and 1,8-cineole (10 and 25 μM) for 24 h, previous to the treatment with H2O2 (1 mM) for 30 min. Nuclear and cytoplasmic Nrf2 protein expression were measured by Western blots. Data are expressed as mean ± SD. Results are representative of three independent experiments. *p < 0.05 versus control, # p < 0.05 versus H2O2.