Figures & data
Figure 1. Hydrogen peroxide toxicity and the effects of genistein on H2O2-induced neuron injury. (A) Neuron viability was analyzed with an IC50 value of 547.77 μM. (B) Neurons pretreated with the indicated concentrations of genistein showed no viability loss. Genistein pretreatment reduced neuron injury induced by H2O2 in a concentration-dependent manner by (C) MTT reduction assay and by (D) measuring LDH release. ##p < 0.01 compared with the control; **p < 0.01 compared with the model.
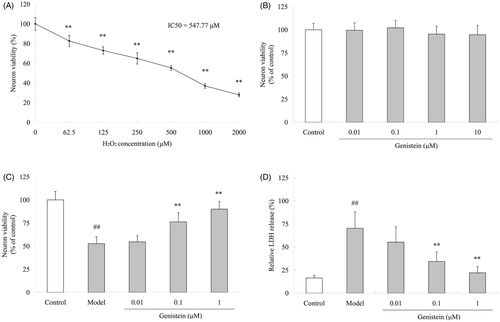
Figure 2. Effects of genistein on H2O2-induced ROS production in neuronal cultures. (A) The DCF fluorescence was observed under an inverted-microscope. H2O2 caused more extensive green fluorescence as compared with the control group, which was partly ameliorated by genistein pretreatment. (B) Quantitative analysis of ROS production in different groups, and the fluorescence intensity was presented as the percentage of increase as compared with the control group. ##p < 0.01 compared with the control; *p < 0.05, **p < 0.01 compared with the model. Scale bar = 50 μm.
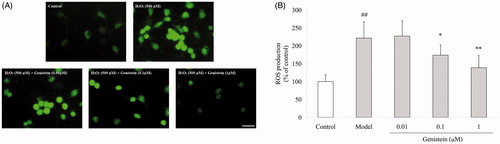
Figure 3. Effects of genistein on H2O2-induced neuron apoptosis in neuronal cultures. (A) Nuclear condensation and morphology was visualized by Hoechest 33258 staining. Nuclei showing clearly bright chromatin condensation and/or fragmentation were regarded as apoptotic cells (indicated by white arrows). (B) Neuron apoptosis was calculated and expressed as the percentage of total cell count. ##p < 0.01 compared with control; **p < 0.01 compared with the model. Scale bar = 50 μm.
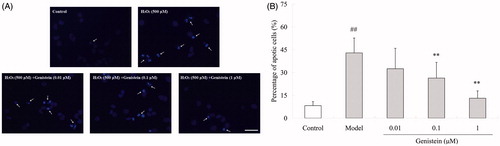
Figure 4. Effects of genistein on the expression or activity of apoptotic-related proteins after H2O2 insult in neuronal cultures. (A) Genistein treatment increased the Bcl-2/Bax ratio as determined by western blot. Semi-quantitative analyses of protein levels were normalized to β-actin expression and compared with control. Genistein treatment reduced the activity of both (B) caspase-3 and (C) caspase-9 induced by H2O2. ## p < 0.01 compared with control; *p < 0.05, **p < 0.01 compared with the model.
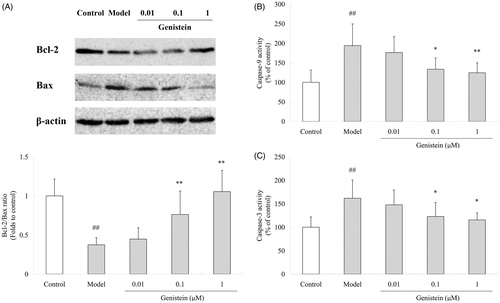
Figure 5. Effects of genistein on NF-κB signal pathway after H2O2 insult in neuronal cultures. (A) Genistein down-regulated the expression and phosphorylation of NF-κB/p65 subunit and (B) prevented the phosphorylation of IκBα. Semi-quantitative analyses of protein levels were normalized to β-actin expression and compared with control. #p < 0.05, ##p < 0.01 compared with control; *p < 0.05, ** p < 0.01 compared with the model.
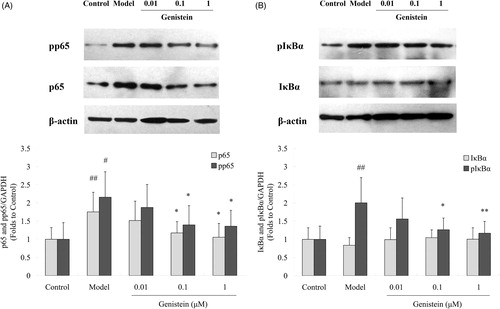
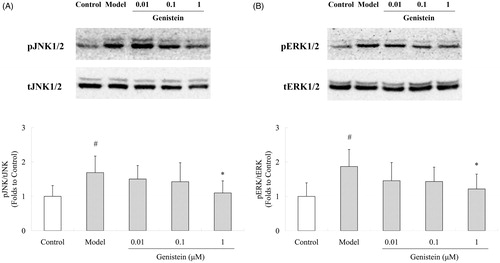
Figure 6. Effects of genistein on JNK1/2 and ERK1/2 signal pathways after H2O2 insult in neuronal cultures. Genistein down-regulated the phosphorylation of (A) JNK1/2 and (B) ERK1/2 levels. Semi-quantitative analyses of phosphorylation levels were normalized to total JNK1/2 and ERK1/2 expression, respectively, and compared with control. #p < 0.05 compared with control; *p < 0.05 compared with the model.