Figures & data
Table 1. Effect of yacon treatment (90 d) on blood glucose and plasma insulin levels under fasting conditions.
Table 2. Terminal clinical chemistry in rats after 90 d of yacon-supplement feeding.
Table 3. Levels of total cholesterol and free fatty acids in liver homogenates at the end of the experimental period.
Figure 1. Effect of yacon root flour (340 mg FOS/kg body weight) on fatty acid composition (μg/g) in the liver of STZ-diabetic rats. Data are the mean ± SD. ap < 0.05 compared with non-diabetic control animals; bp < 0.05 compared with diabetic control animals. n = 6 animals per group. NC, non-diabetic control animals; DC, diabetic control animals; DY340, diabetic animals treated with yacon root flour (340 mg FOS/kg body weight).
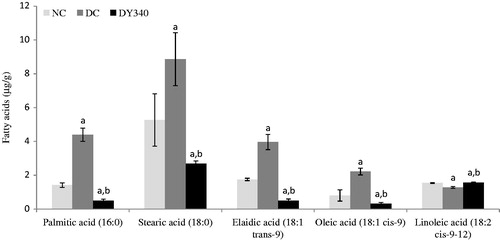
Figure 2. Effect of yacon root flour (340 mg FOS/kg body weight) on malondialdehyde (MDA) concentrations in (a) liver and (b) kidney of normal and STZ-diabetic rats. Data are the mean ± SD. ap < 0.05 compared with non-diabetic control animals; bp < 0.05 compared with diabetic control animals. n = 6 animals per group. NC, non-diabetic control animals; DC, diabetic control animals; DY340, diabetic animals treated with yacon root flour (340 mg FOS/kg body weight).
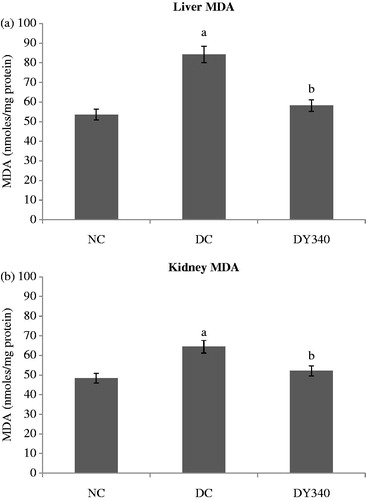
Table 4. Effects of treatment with yacon root flour for 90 d on liver CAT, SOD and GPx activities as well as GSH and MDA levels of normal and diabetic rats.
Table 5. Effects of treatment with yacon root flour for 90 d on kidney CAT, SOD, and GPx activities as well as GSH and MDA levels of normal and diabetic rats.
Figure 3. Effect of yacon root flour (340 mg FOS/kg body weight) on catalase (CAT) activity in (a) liver and (b) kidney of normal and STZ-diabetic rats. Data are the mean ± SD. ap < 0.05 compared with non-diabetic control animals; bp < 0.05 compared with diabetic control animals. n = 6 animals per group. NC, non-diabetic control animals; DC, diabetic control animals; DY340, diabetic animals treated with yacon root flour (340 mg FOS/kg body weight).
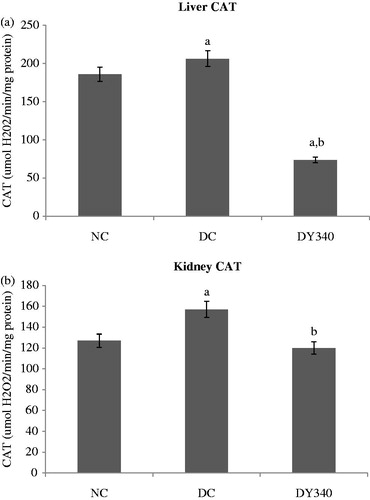
Figure 4. Effect of yacon root flour (340 mg FOS/kg body weight) on superoxide dismutase (SOD) activity in (a) liver and (b) kidney of normal and STZ-diabetic rats. Data are the mean ± SD. ap < 0.05 compared with non-diabetic control animals; bp < 0.05 compared with diabetic control animals. n = 6 animals per group. NC, non-diabetic control animals; DC, diabetic control animals; DY340, diabetic animals treated with yacon root flour (340 mg FOS/kg body weight).
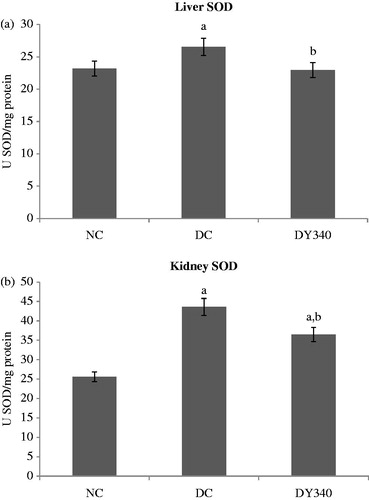
Figure 5. Effect of yacon root flour (340 mg FOS/kg body weight) on glutathione peroxidase (GPx) activity in (a) liver and (b) kidney of normal and STZ-diabetic rats. Data are the mean ± SD. ap < 0.05 compared with non-diabetic control animals; bp < 0.05 compared with diabetic control animals. n = 6 animals per group. NC, non-diabetic control animals; DC, diabetic control animals; DY340, diabetic animals treated with yacon root flour (340 mg FOS/kg body weight).
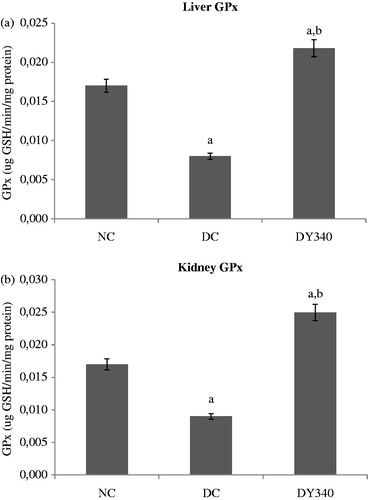
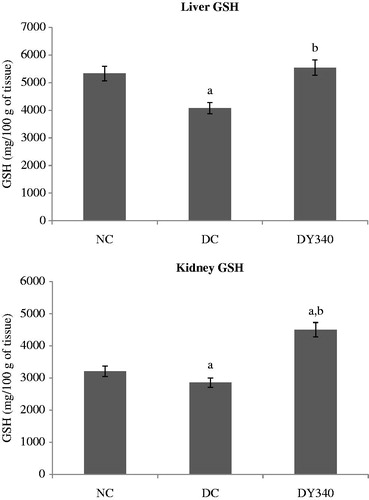
Figure 6. Effect of yacon root flour (340 mg FOS/kg body weight) on reduced glutathione (GSH) concentration in (a) liver and (b) kidney of normal and STZ-diabetic rats. Data are mean ± SD. ap < 0.05 compared with non-diabetic control animals; bp < 0.05 compared with diabetic control animals. n = 6 animals per group. NC, non-diabetic control animals; DC, diabetic control animals; DY340, diabetic animals treated with yacon root flour (340 mg FOS/kg body weight).