Figures & data
Figure 1. (a) Calibration curve of MTT assay and (b) growth curve of different implant HaCaT cells densities in 96-well plates. All values are expressed as mean ± SEM of three replicates from the same plate.
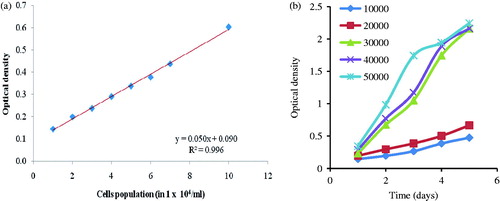
Figure 2. Antiproliferative activity of different extractives of P. simplex, C. juncea, L. aspera. and V. glabrata. All values are expressed as mean ± SEM of three replicates from the same plate. *p < 0.05 when compared with dithranol.
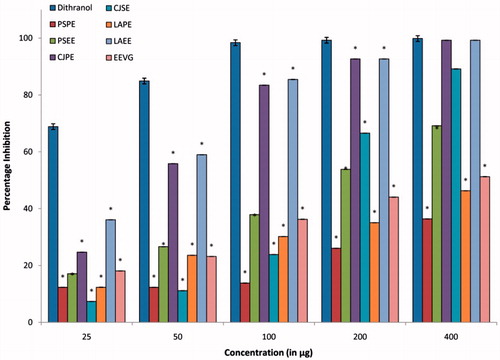
Figure 3. Effect of different extractives of P. simplex, C. juncea, L. aspera, and V. glabrata on nitric oxide production in LPS-stimulated HaCaT cell culture. All values were expressed as mean ± SEM of three replicates from the same plate, *p < 0.05 when compared with dithranol.
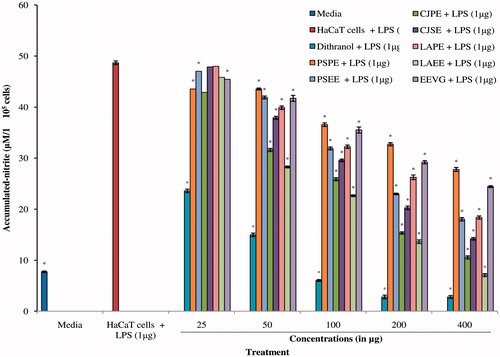
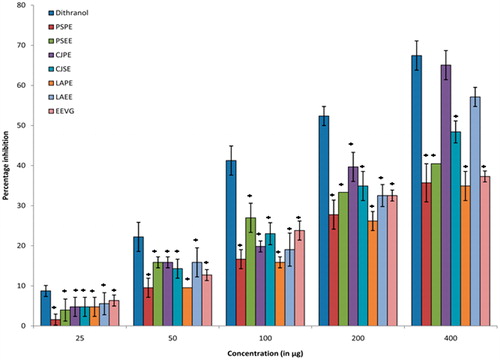
Figure 4. Effect of different extractives of P. simplex, C. juncea, L. aspera, and V. glabrata on lipid peroxidation in HaCaT cell culture. All values were expressed as mean ± SEM of three replicates from the same plate, *p < 0.05 when compared with dithranol.