Figures & data
Figure 1. Effects of CsA and/or WGO on serum ALT (A) and AST (B) levels in male Wistar albino rats. Data represent means ± SD (n = 6), *p < 0.05, ***p < 0.001 versus control, ###p < 0.001 versus CsA-alone-treated animals.
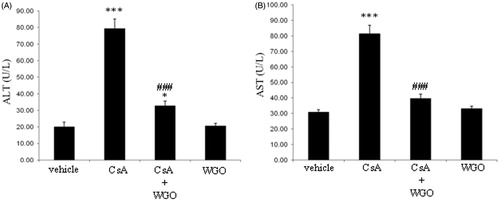
Figure 2. Effects of CsA and/or WGO on hepatic content of MDA (A) as well as iNOS (B) and NF-κB expression (C) in male Wistar albino rats. Data represent means ± SD (n = 6), *p < 0.05, **p < 0.01, ***p < 0.001 versus control, ###p < 0.001 versus CsA-alone-treated animals.
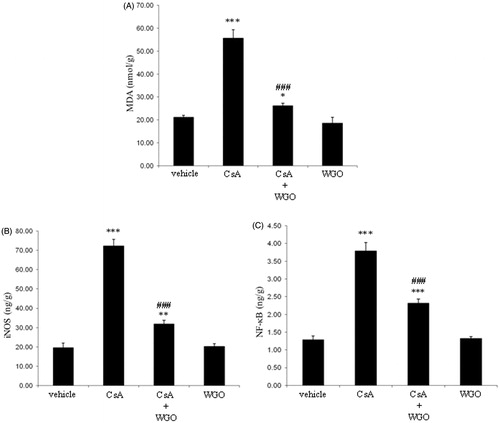
Figure 3. Effects of CsA and/or WGO on hepatic content of GSH (A) as well as enzymatic activities of SOD (B) and CAT (C) in male Wistar albino rats. Data represent means ± SD (n = 6), *p < 0.05, **p < 0.01, ***p < 0.001 versus control, ###p < 0.001 versus CsA-alone-treated animals.
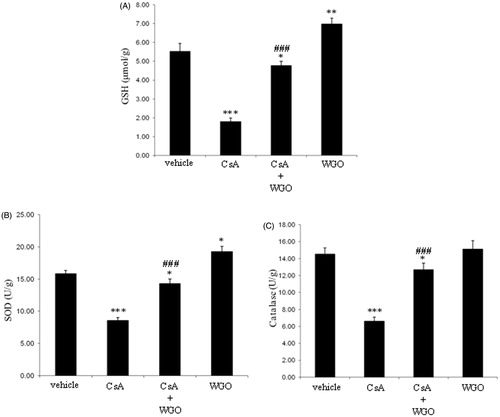
Figure 4. (A) A photomicrography of normal liver tissue (H&E 100). (B) A photomicrography of liver tissue of rats received CsA showing local hepatic area of necrosis (thin arrow) and area with deposition of hemosidrin and inflammatory cells (thick arrow) (H&E 100). (C) A photomicrography of liver tissue for the third group (CsA + WGO) showing improvement at the necrotic areas (thin arrows) and deposition of hyaline material in the central vein (thick arrow) with minimal edema in the hepatic cells (H&E 200). (D) A photomicrography of liver tissue for the fourth group (WGO) showing more or less the normal hepatic architecture without any pathological finding (H&E 200).
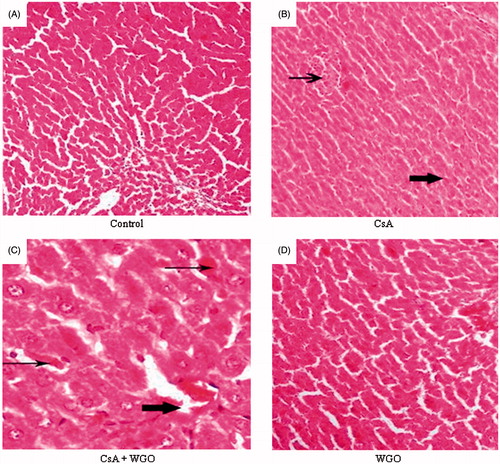
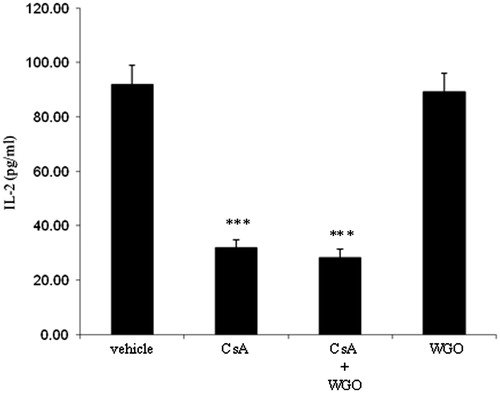
Figure 5. Effects of CsA and/or WGO on serum IL-2 level in male Wistar albino rats. Data represent means ± SD (n = 6), ***p < 0.001 versus the control.