Figures & data
Figure 1. Chemical structure of brazilin.
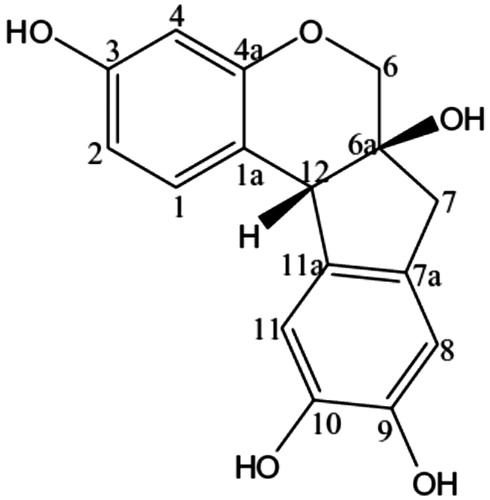
Figure 2. Percentage inhibitions of DPPH radicals by BRE, CSE, and brazilin at different concentrations, n = 3 (Nirmal & Benjakul, Citation2011).
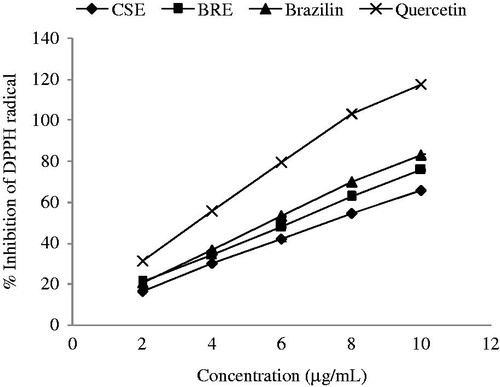
Table 1. Radical scavenging activity of BRE, CSE, and brazilin determined by β-carotene bleaching assay (Panichayupakaranant et al., Citation2010).
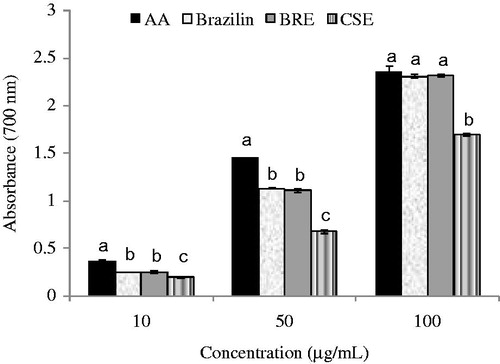
Figure 3. Reducing power of ascorbic acid, brazilin, BRE, and CSE at different concentrations. Small letters within the same concentration of different samples indicate significant difference (p < 0.05). AA, ascorbic acid; BRE, brazilin-rich extract; CSE, crude ethanol extract of C. sappan heartwood.