Figures & data
Figure 1. Clone characteristics and micrograph of DSE8 isolated from E. wushanense root on PDA. (A) Front of the clone; (B) back of the clone; (C) hyphae ×400.
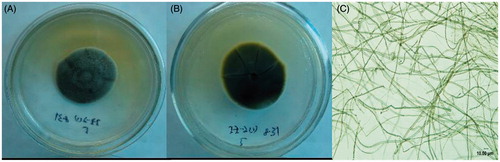
Figure 2. Microstructure in the roots of E. wushanense plants inoculated with different DSE strains. (A) Microsclerotia in cortical cells ×400; (B) resynthesis treatment inoculated with the DSE8 strain; (C) resynthesis treatment inoculated with the DSE10 strain; (D) resynthesis treatment inoculated with the DSE5 strain; (E) resynthesis treatment inoculated with the DSE2 strain; (a) melanized hyphae.
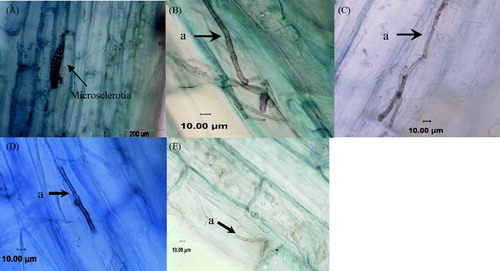
Figure 3. Phylogenesis analysis of seven DSE fungi isolated from E. wushanense roots. The phylogenesis of the MP tree is based on ITS1-5.8S-ITS2 rDNA. Blumeria graminis was chosen as an outgroup (tree length = 589, CI = 0.735, RI = 0.921, RC = 0.677, HI = 0.265). The number at each branch indicates the percentage of trees from 1000 bootstrap replications in which the branch occurred. Bootstraps above 50% are indicated.
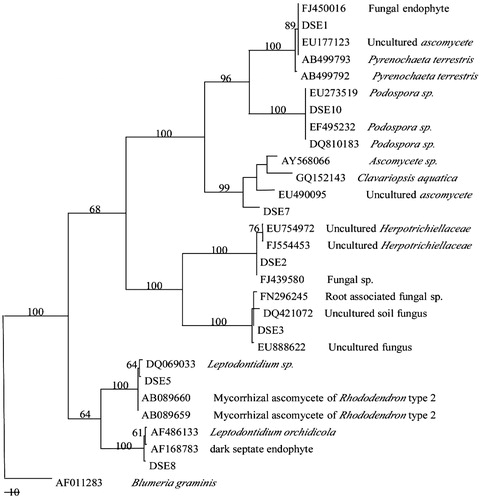
Figure 4. The growth of E. wushanense plants inoculated with different DSE strains for 90 d. CK means uninoculated control.
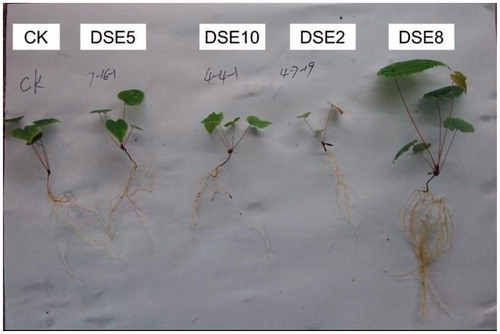
Figure 5. The effects of DSE inoculations on the shoot biomass, root biomass, plant height, and root length of E. wushanense (, n = 3). Control means uninoculated plants. Different letters indicate a significant difference at p < 0.01.
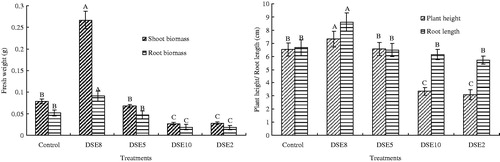
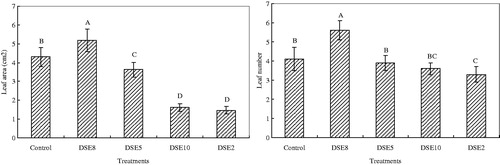
Figure 6. Effects of DSE inoculations on leaf area and leaf number of E. wushanense (, n = 3). Control means uninoculated plants. Different letters indicate a significant difference at p < 0.01.