Figures & data
Figure 1. Effect of piperine (10, 20, and 40 mg/kg) and montelukast (10 mg/kg) treatment on body weight in allergic rhinitis-induced mice (n = 6). Values are expressed in mean ± SEM. #p < 0.05, ###p < 0.001 compared with the normal group, ***p < 0.001 compared with the AR control group. Figure in parentheses indicates dose in mg/kg, p.o. PIP, piperine; Monte, montelukast.
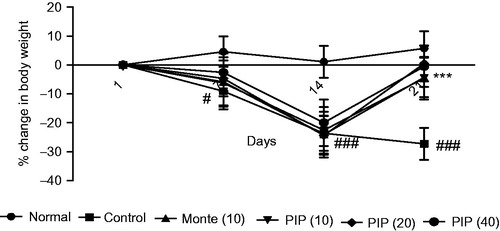
Table 1. Effect of piperine (10, 20, and 40 mg/kg, p.o.) and montelukast (10 mg/kg, p.o.) on sneezing, nasal rubbing, and nasal redness in allergic rhinitis-induced mice.
Figure 2. Effect of piperine (10, 20, and 40 mg/kg) and standard drug montelukast (10 mg/kg) on nitric oxide (μg/ml) (A), histamine concentration (μg/ml) (B), average spleen weight (mg) (C), IL-1β concentration (pg/ml) (D), Ig-E concentration (ng/ml) (E), and IL-6 concentration (pg/ml) (F) in allergic rhinitis-induced mice (n = 6). Values are expressed in mean ± SEM. ###p < 0.001 compared with the normal group, *p < 0.05, **p < 0.01, and ***p < 0.001 compared with the AR control group. Figure in parentheses indicated dose in mg/kg, p.o. PIP, piperine; Monte, montelukast.
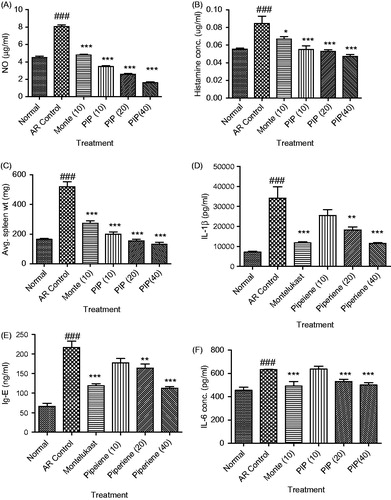
Figure 3. Effect of piperine treatment (10, 20, and 40 mg/kg) and cetrizine (10 mg/kg) on OVA-induced paw edema (n = 6). Values are expressed in mean ± SEM. **p < 0.01 and ***p < 0.001 compared with the control group. Figure in parentheses indicated dose in mg/kg, p.o. PIP, piperine; Cet, cetrizine.
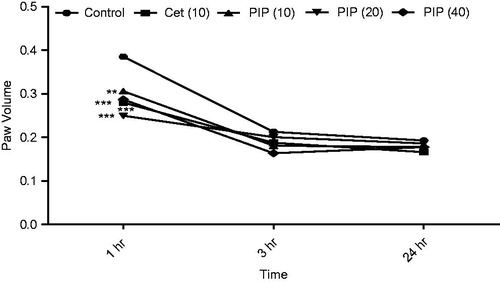
Figure 4. Effect of piperine treatment (10, 20, and 40 mg/kg) and disodium cromoglyacate (50 mg/kg) on mast cell degranulation. (a) The normal group showing intact mast cells, (b) the AR control group showing degranulation of mast cells, (c) montelukast (10 mg/kg) treated group section showing partial cell degranulation, (d) PIP (10 mg/kg), (e) PIP (20 mg/kg), and (f) the PIP (40 mg/kg) treated group shows stabilization of mast cells in a dose-dependent manner.
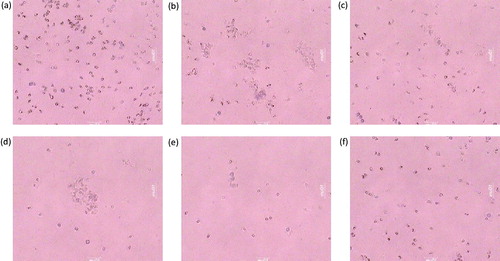
Table 2. Effect of piperine (10, 20, and 40 mg/kg, p.o.) and disodium chromoglycate (50 mg/kg, p.o.) treatment on mast cell degranulation.
Figure 5. Histological alteration in lung tissue of mice: photomicrograph of lung sections stained with hematoxylin and eosin: (a) the normal group shows alveoli and bronchioles having normal architecture. Epithelial cells linings are intact and inflammation is absent. (b) The AR control group section shows abnormal bronchiole epithelium and degenerated alveolar sacs. (c) Montelukast (10 mg/kg) treated group section shows partial cell disruption in alveoli and bronchioles. The epithelial cell linings show less damage. (d) The PIP (10 mg/kg) treated group demonstrates intact epithelial cell linings; partial protection of bronchioles and alveoli, with minimum Inflammation. (e) The PIP (20 mg/kg) treated group shows moderate intact alveoli and bronchiolar structures. (f) The PIP (40 mg/kg) treated group sections showed more protective effect on alveoli and bronchiolar epithelial membrane. A, alveoli; E, epithelium; B, bronchiole; PV, pulmonary vein; PIP, piperine; Monte, montelukast. Figure in parentheses indicates dose in mg/kg, p.o. (40 × ).
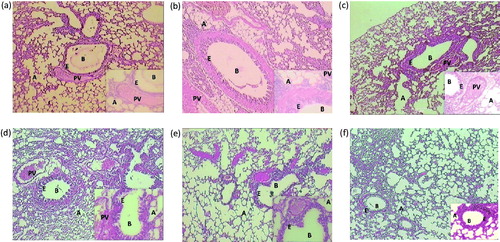
Figure 6. Histological alteration of spleen in mice: (a) the normal group shows intact white and red cell pulps. (b) The AR control group shows the complete disruption in white and red pulp cells, hyperplasia is observed. (c) Montelukast (10 mg/kg) group shows more protective effect on red and white pulps and less hyperplasia is observed. (d) PIP (10 mg/kg) shows protective effect on red and white pulp cells. (e) PIP (20 mg/kg) shows more protection of both cells and intact structure with less hyperplasia. (f) PIP (40 mg/kg) total protection of both pulp and hyperplasia is not observed. RP, red pulp; WP, white pulp; H, hyperplasia; PIP, piperine; Monte, montelukast. Figure in parentheses indicates dose in mg/kg, p.o. (40 × ).
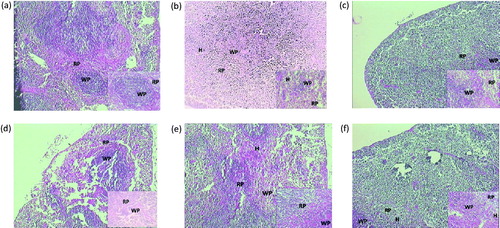
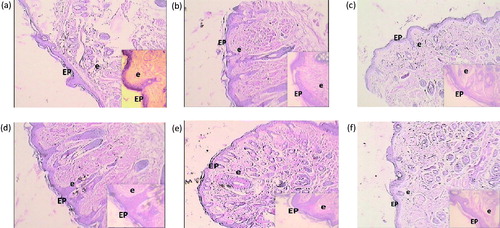
Figure 7. Histological alteration of nasal mucosa in mice: (a) the normal group shows intact epithelium and very few eosinophil infiltrations. (b) The AR control group shows abnormal epithelium, thickened subepithelial smooth muscle layer, and infiltration of eosinophil. (c) The montelukast (10 mg/kg) group shows intact epithelium and reduced eosinophil infiltration. (d) PIP (10 mg/kg) shows less intact epithelium and moderate number of eosinophil infiltrations. (e) PIP (20 mg/kg) shows more intact epithelium and reduced eosinophil infiltration. (f) PIP (40 mg/kg) shows intact epithelium and few eosinophil infiltration. EP, epithelium; e, eosinophiles; PIP, piperine; Monte, montelukast. Figure in parentheses indicates dose in mg/kg, p.o. (40 × ).