Figures & data
Figure 1. Structure of the CYXD.
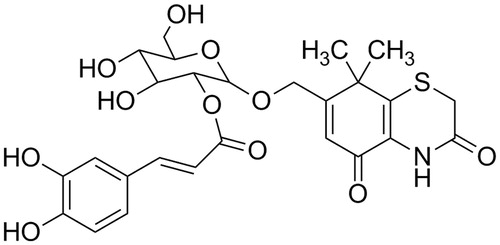
Table 1. The primer used for the real-time PCR.
Figure 2. Effect of CYXD on survival rate of CLP mice. Mice were divided into five groups (n = 20): sham, control, and CYXD (10, 20, and 40 mg/kg/d). The vehicle (control, 10 mL/kg) and CYXD were administered by intraperitoneal injection. Each column represented the mean ± SEM (n = 20). *p < 0.05 and ** p < 0.01, compared with the control.
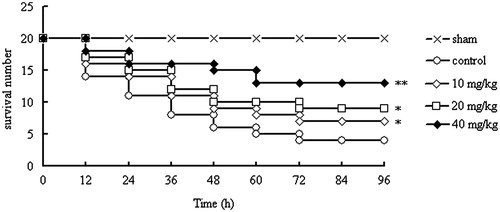
Figure 3. Effect of CYXD on TNF-α and IL-6 in the serum of CLP mice. Mice were divided into five groups (n = 10): sham, control, and CYXD (10, 20, and 40 mg/kg). The vehicle (control, 10 mL/kg) and CYXD were administered by intraperitoneal injection. Each column represented the mean ± SEM (n = 10). *p < 0.05 and **p < 0.01, compared with the control.
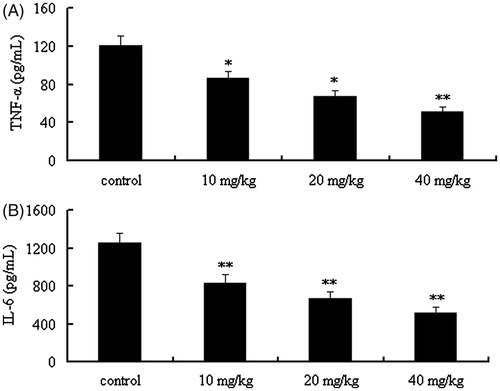
Figure 4. CYXD neutralizes LPS activity in vitro. Each column represented the mean ± SEM (n = 4). *p < 0.05 and **p < 0.01, compared with the control.
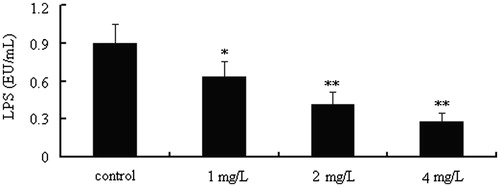
Figure 5. Effects of CYXD on TNF-α and IL-6 mRNA expressions in RAW 264.7 cells induced by LPS (100 ng/mL). TNF-α and IL-6 mRNA expressions were normalized by β-actin, and fold changes in mRNA expression are shown and expressed as mean ± SEM (n = 4). *p < 0.05 and **p < 0.01, compared with the control.
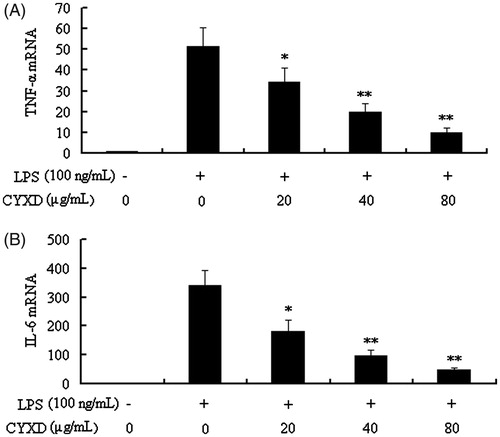
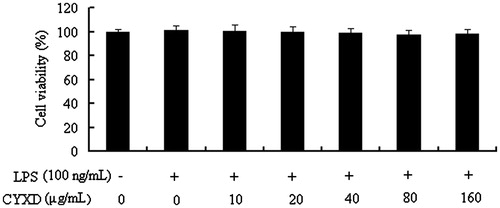
Figure 6. Effects of CYXD on viability of RAW 264.7 cells. Each column represented the mean ± SEM (n = 4).