Figures & data
Figure 1. Chemical structure of kaempferol.
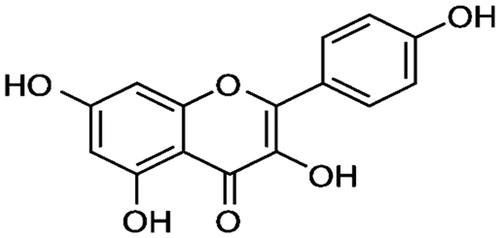
Figure 2. Effect of kaempferol on total ATPases in the erythrocytes and tissues of normal and STZ-induced diabetic rats. Values are given as means ± SD from six rats in each group. Values not sharing a common superscript vertically differ significantly at p < 0.05 (DMRT). a-μmol of Pi liberated per hour. Group 1: normal control; Group 2: normal + kaempferol (100 mg/kg/d); Group 3: diabetic control; Group 4: diabetic + kaempferol (100 mg/kg/d); Group 5: diabetic + glibenclamide (600 µg/kg/d).
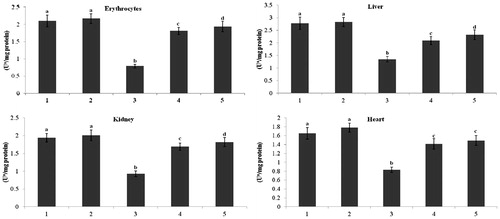
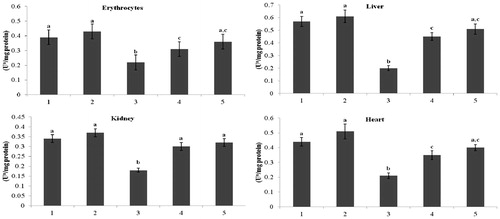
Figure 3. Effect of kaempferol on Na+/K+-ATPase in the erythrocytes and tissues of normal and STZ-induced diabetic rats. Values are given as means ± SD from six rats in each group. Values not sharing a common superscript vertically differ significantly at p < 0.05 (DMRT). a-μmol of Pi liberated per hour. Group 1: normal control; Group 2: normal + kaempferol (100 mg/kg/d); Group 3: diabetic control; Group 4: diabetic + kaempferol (100 mg/kg/d); Group 5: diabetic + glibenclamide (600 µg/kg/d).
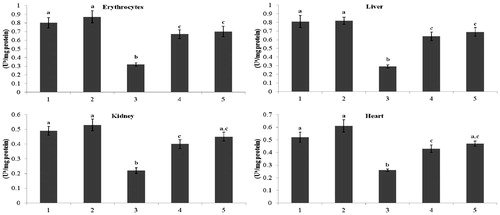
Figure 4. Effect of kaempferol on Ca2+-ATPase in the erythrocytes and tissues of normal and STZ-induced diabetic rats. Values are given as means ± SD from six rats in each group. Values not sharing a common superscript vertically differ significantly at p < 0.05 (DMRT). a-μmol of Pi liberated per hour. Group 1: normal control; Group 2: normal + kaempferol (100 mg/kg/d); Group 3: diabetic control; Group 4: diabetic + kaempferol (100 mg/kg/d); Group 5: diabetic + glibenclamide (600 µg/kg/d).
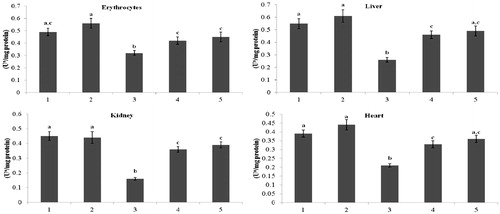
Figure 5. Effect of kaempferol on Mg2+-ATPase in the erythrocytes and tissues of normal and STZ-induced diabetic rats. Values are given as means ± SD from six rats in each group. Values not sharing a common superscript vertically differ significantly at p < 0.05 (DMRT). a-μmol of Pi liberated per hour. Group 1: normal control; Group 2: normal + kaempferol (100 mg/kg/d); Group 3: diabetic control; Group 4: diabetic + kaempferol (100 mg/kg/d); Group 5: diabetic + glibenclamide (600 µg/kg/d).