Figures & data
Table 1. MIC values of A. ovoidea extracts (μg/mL) are presented, and the highest MIC value was underlined*.
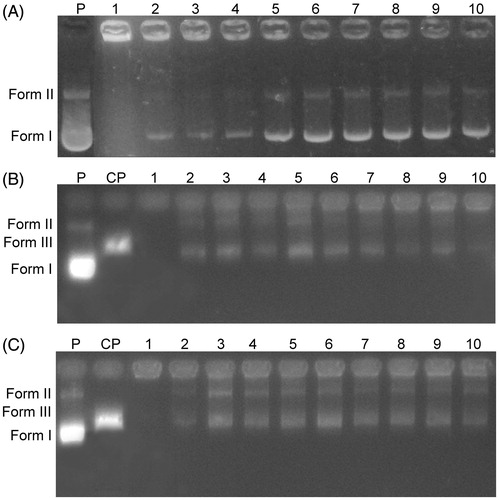
Figure 1. (A) Gel electrophoretic mobility of pBR322 plasmid DNA and different concentrations of the extract. (B) Digestion of the mixtures of pBR322 plasmid DNA and extract by BamHI. (C) Digestion of the mixtures of pBR322 plasmid DNA and extract by HindIII. (P) untreated pBR322 plasmid DNA; (CP) pBR322 plasmid DNA is linearized by BamHI or HindIII.