Figures & data
Figure 1. Effects of tectorigenin on 3T3-L1 differentiation. (A) Tectorigenin inhibited 3T3-L1 cells adipocyte differentiation induced by DM. The cells were stained with Oil Red O on day 8. GM, growth medium; DM, differentiation medium; Tec, tectorigenin. The concentrations of tectorigenin were 25, 50, and 75 μM. After 7 d of differentiation, the cells were harvested, and (B) triglyceride contents or (C) GPDH activity was determined as described in Materials and methods. Data (mean ± SEM) are representative of three independent experiments. #p < 0.01 versus GM; *p < 0.05, **p < 0.01, and ***p < 0.001 versus control (DM induction).
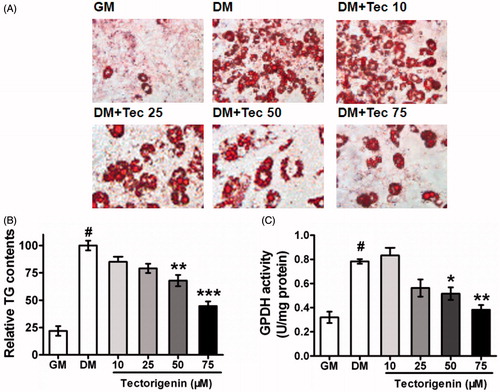
Figure 2. Effects of tectorigenin on adipogenesis-related genes expression during 3T3-L1 differentiation. At 7 d, after inducing differentiation, total RNA was isolated and mRNA level of the indicated genes were measured by real-time quantitative RT-PCR. GM, growth medium; DM, differentiation medium; Tec, tectorigenin 50 μM. Data (mean ± SEM) are representative of three independent experiments. #p < 0.01 versus GM; *p < 0.05, **p < 0.01, and ***p < 0.001 versus DM induction.
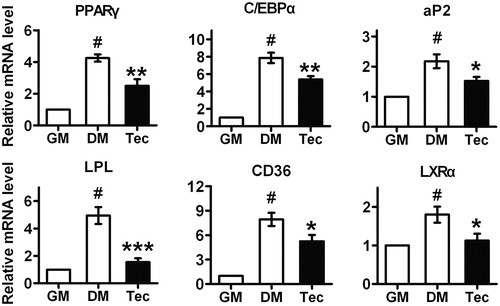
Figure 3. Effects of tectorigenin on adipocytokines expression in 3T3-L1 cells treated with TNF-α. 3T3-L1 adipocytes were pre-incubated with 0–75 μM Tec (tectorigenin) for 6 h and exposed to TNF-α (5 ng/mL) for 16 h. The secreted proteins (A) IL-6, (B) MCP-1, and (C) adiponectin in the conditioned medium were measured using ELISA kits. Data (mean ± SEM) are representative of four independent experiments. #p < 0.01 versus control; *p < 0.05, **p < 0.01, and ***p < 0.001 versus TNF-α (5 ng/mL).
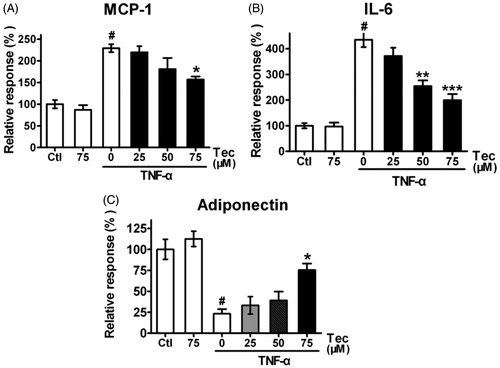
Figure 4. Effects of tectorigenin on PPARγ transactivation. Reporter gene assays were performed in HEK293 cells cotransfected with mPPARγ and PPRE-luc plasmids. (A) Tectorigenin moderately activated PPRE-mediated transcription in HEK293 cells. Rosiglitazone (Rosi) was used as a positive control. Data (mean ± SEM) are percentage of 1 μM rosiglitazone (n = 3). (B) Tectorigenin antagonized rosiglitazone (0.5 μM)-mediated PPARγ transactivation (n = 3). GW9662 was used as a positive control.
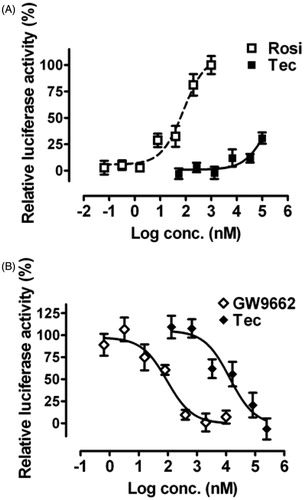
Figure 5. Tectorigenin promoted basal and insulin-stimulated glucose uptake in 3T3-L1 adipocytes. Differentiated 3T3-L1 adipocytes were treated with the indicated concentrations of tectorigenin. After 24 h incubation, 2-DOG uptake in adipocytes was measured in the absence or presence of 100 nM insulin for 30 min. Data (mean ± SEM) are representative of three independent experiments. Rosi, rosiglitazone (1 μM). #p < 0.05 versus the control group without insulin; *p < 0.05 and **p < 0.01 versus the control group with 100 nM insulin.
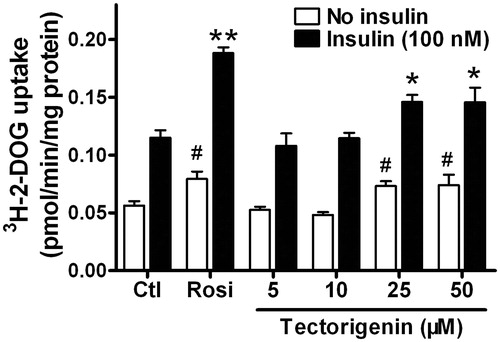
Figure 6. Tectorigenin inhibited IKK/NF-κB transactivation and p65 nuclear translocation. (A) Tectorigenin inhibited TNF-α-induced NF-κB transactivation in reporter gene assay. 3T3-L1 adipocytes transfected with pNF-κB-luc were treated with the indicated concentrations of tectorigenin with or without TNF-α (5 ng/mL) for 24 h, and then luciferase activity was determined. Data (mean ± SEM) are representative of three independent experiments. #p < 0.05 versus control; *p < 0.05, **p < 0.01, and ***p < 0.001 versus TNF-α (5 ng/mL). (B) 3T3-L1 adipocytes were treated with Tec at 50 μM for 24 h and then TNF-α at 5 ng/mL. Then cell lysates were resolved by SDS-PAGE and analyzed using antibodies against total and phosphorylated IKK and IκBα. (C) Tectorigenin inhibited translocation of p65 into nucleus as detected by Western blot.
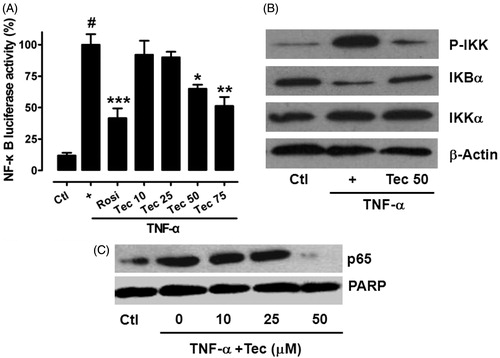
Figure 7. Effects of tectorigenin on insulin sensitivity in the type 2 diabetic rats. (A) Treatment with tectorigenin reduced the concentrations of blood glucose in both fasting and fed type 2 diabetic rats. Ctl, normal rats group; model, HFD/STZ rats group. #p < 0.05 versus control; *p < 0.05 and **p < 0.01 versus the model group. (B) Tectorigenin increased the glucose disappearance constant (KITT) during an ITT, which represents insulin sensitivity in vivo, in HFD/STZ rats. Ctl, normal rats group; model, HFD/STZ rats group. #p < 0.05 versus control; **p < 0.01 versus the model group. (C) Effects of tectorigenin on insulin-stimulated IRS1 and Akt phosphorylation and glut4 expression in adipose tissue ex vivo. Abdominal adipose tissues from HFD/STZ rats were minced and incubated with Rosi or tectorigenin for 4 h, exposed to 50 nM insulin for 20 min, and then lysed. Shown are western blots to detect the level of IRS1-pTy, IRS1, Akt-pT308, Akt, and glut4. Similar results were obtained from three independent experiments.
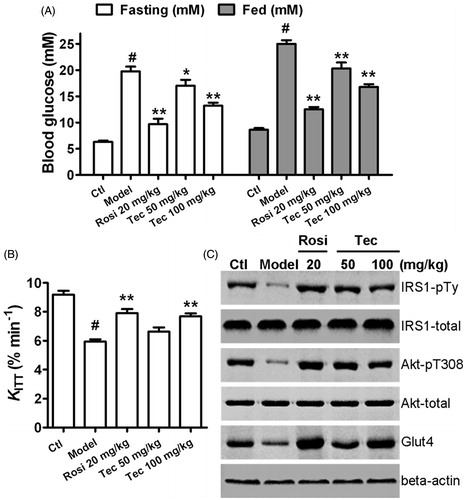
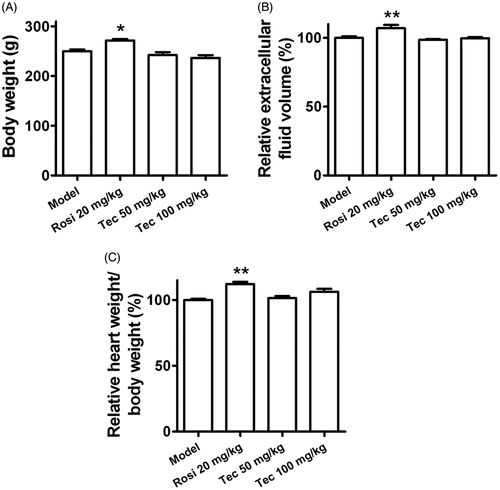
Figure 8. Effects of tectorigenin on body weight gain, fluid retention, or cardiac hypertrophy in the type 2 diabetic rats. (A) Rosi (20 mg/kg) increased the body weight of the type 2 diabetic rats, but tectorigenin (50 and 100 mg/kg) did not. Model, HFD/STZ rats group. *p < 0.05 versus the model group. (B) Tectorigenin did not increase the extracellular fluid volume as Rosi did in the type 2 diabetic rats. Model, HFD/STZ rats group. **p < 0.01 versus the model group. (C) Effects of tectorigenin on heart weight of the type 2 diabetic rats. Model, HFD/STZ rats group. **p < 0.01 versus the model group.