Figures & data
Figure 1. Effect of digitoflavone on viability of H2O2-exposed cells. PC12 cells were pretreated with 10, 20, and 50 µM concentrations of digitoflavone for 2 h and then exposed to H2O2 (200 μM) for 18 h. MTT assay was used to determine cells’ viability. The mean of three independent experiments is shown. ***p < 0.001 Significantly different from control cells. #p < 0.05 and ###p < 0.001 Significantly different from H2O2-treated cells.
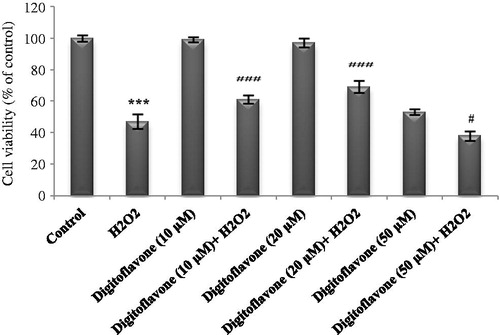
Figure 2. Effect of digitoflavone on H2O2-induced intracellular ROS and altered Rhodamine density as an indicator of ΔΨm in PC12 cells. Cells were pretreated with 10 and 20 µM concentrations of digitoflavone for 2 h and then exposed to 200 µM H2O2 for additional 18 h. (A) The level of ROS formation was measured using DCF-DA fluorescent probe. (B) and (C) Rhodamine density. The mean of three independent experiments is shown. ***p < 0.001 Significantly different from control cells. #p < 0.05 and ###p < 0.001 Significantly different from H2O2-treated cells.
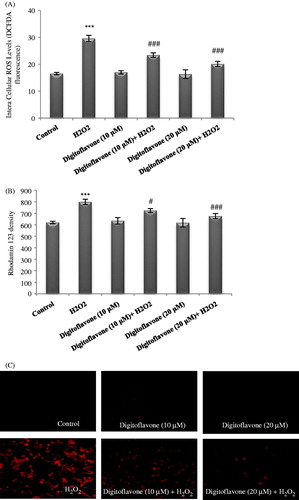
Figure 3. Western blot analysis to measure the effect of digitoflavone on pAMPK/AMPK ratio and mitochondrial biogenesis factors PGC-1α, NRF-1, and TFAM in PC12 cells. (A) PC12 cells pretreated for 2 h with digitoflavone (10 and 20 µM) and then exposed to H2O2 (200 μM) for 18 h. About 20 μg of proteins were separated on SDS-PAGE, Western blotted, probed with anti-pAMPK, PGC-1α, -NRF-1, and -TFAM and reprobed with anti-AMPK and β-actin antibodies. (One representative Western blot was shown; n = 3). (B) The density of p-AMPK bands was measured and the ratio to AMPK was calculated. The mean of three independent experiments is shown. (C) The density of PGC-1α bands was measured and the ratio to β-actin was calculated. The mean of three independent experiments is shown. (D) The density of NRF-1 bands to the β-actin ratio. (E) The density of TFAM bands to the β-actin ratio. ***p < 0.001 Significantly different from control cells. #p < 0.05, ##p < 0.01 and ###p < 0.001 Significantly different from H2O2-treated cells.
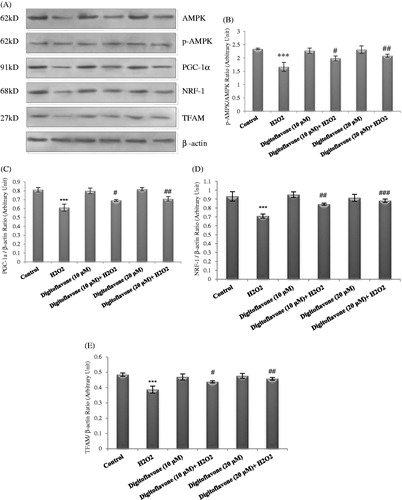
Figure 4. Effect of digitoflavone on CAT activity and GSH level in PC12 cells exposed to H2O2. PC12 cells were pretreated with 10 and 20 µM concentrations of digitoflavone for 2 h and then were exposed to H2O2 (200 μM) for 18 h. (A) GSH level was determined by adding DTNB and measuring the absorbance at 412 nm. (B) Activity of CAT was measured based on the decomposition of H2O2. The mean of three independent experiments is shown. ***p < 0.001 Significantly different from control cells. #p < 0.05 and ###p < 0.001 Significantly different from H2O2-treated cells.
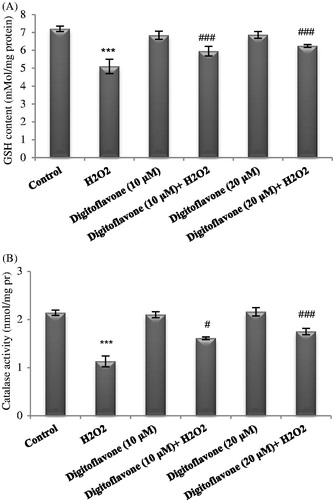
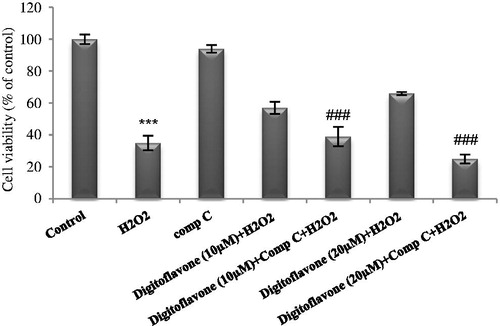
Figure 5. Effect of AMPK inhibition on viability of digitoflavone pretreated, H2O2-insulted cells. PC12 cells were pretreated with 10 and 20 µM concentrations of digitoflavone and compound C, then exposed to H2O2 (200 μM) for 18 h. MTT assay was used to determine cell viability. The mean of three independent experiments is shown. ***p < 0.001 Significantly different from control cells. ###p < 0.001 Significantly different from digioflavone (10 µM and/or 20 µM) pretreated, H2O2-insulted cells.