Figures & data
Figure 1. Isolation and fractionation of protein extracts from Phlomis lanata. Protein extracts from the aerial parts of the plant were dialyzed and submitted to ion exchange chromatography using a Q-Sepharose column and a 0–2 M NaCl gradient (A). The nomenclature used for the different fractions is marked at the upper part of the graphic. The isolated fractions were concentrated and submitted to SDS-PAGE electrophoresis (B) revealed either with Coomassie (upper panel) or silver staining (lower panel). Protein concentration in the different fractions was determined by the Lowry assay (C).
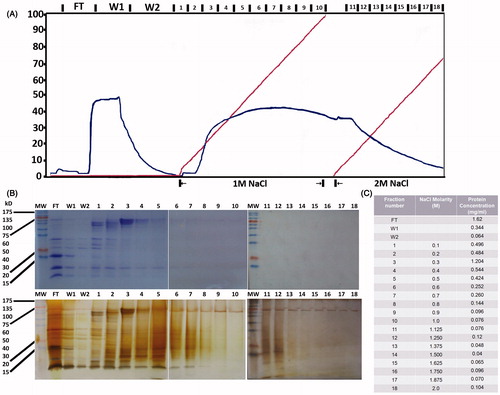
Figure 2. Effect of Phlomis lanata fractionated protein extracts on proliferation of total spleen cells or isolated T cell subpopulations. All FT, W1, W2, and fractions generated with 100 mM–1 M NaCl were added at the concentration of 5 μg/ml to total spleen cells and proliferation was assessed by 3HTdR uptake experiments (A). In these experiments concanavalin A was used as positive control for T cell proliferation and generated 7602 ± 755 cpm. The W1 and F6 (600 mM) fractions were chosen for further experimentation and added to CD4+ and CD8+ (B1) or CD25+CD4+ and CD25+CD8+ (B2) T cell populations in the context of 3HTdR uptake experiments. The results are expressed as cpm ± SEM. One out of five experiments with similar results is shown here. The asterisks (*) denote a statistically significant difference as compared with the untreated control (*p < 0.005, **p < 0.001).
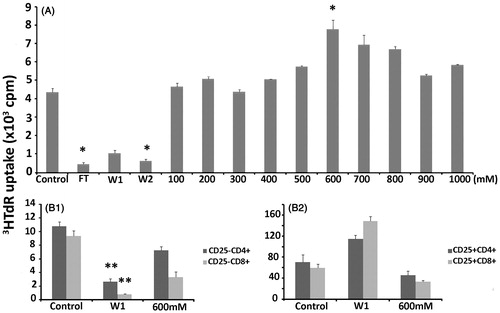
Figure 3. Effect of protein fractions W1 and F6 on macrophage proliferation. Macrophages were cultured in the presence or not of W1 and F6 (600 mM) and assessed for proliferation following 3HTdR uptake experiments. The results are expressed as cpm ± SEM. One out of three experiments with similar results is shown here. The asterisks (*) denote a statistically significant difference as compared to the untreated control (**p < 0.001).
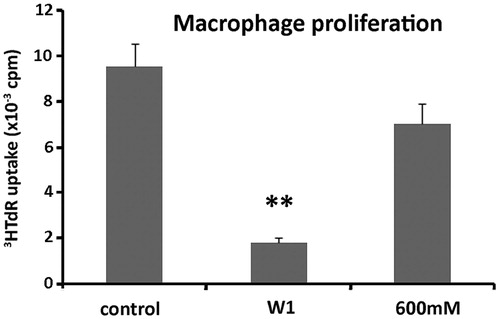
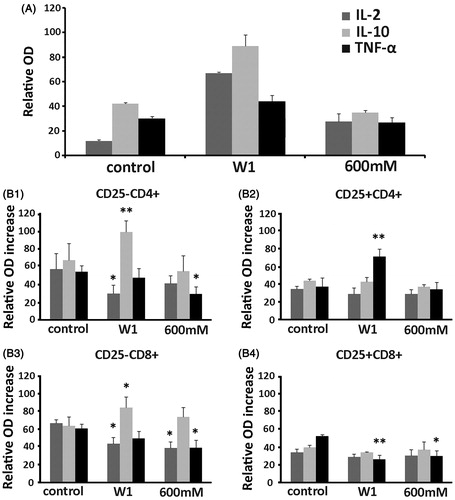
Figure 4. Effect of protein fractions W1 and F6 on cytokine production by total spleen cells (A) or T cell subpopulations (B1–B4). Total spleen cells or isolated T cell sub-populations were cultured in the presence of W1 or F6 (600 mM) and culture supernatants were tested for their content in IL-2, IL-10, or TNF-α by ELISA. The results are expressed as relative optical density (OD) increase over background ± SEM. One out of six experiments with similar results is shown here. The asterisks (*) denote a statistically significant difference as compared with the untreated control (*p < 0.005, **p < 0.001).