Figures & data
Figure 1. Chemical structure of NGR1.
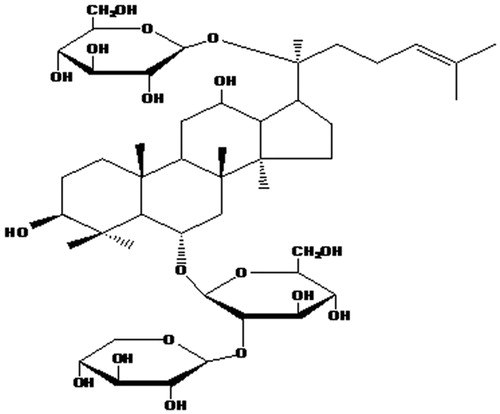
Table 1. Regression equation, linear range, low limits of quantification (LLOQ) for probe substrates in rat plasma.
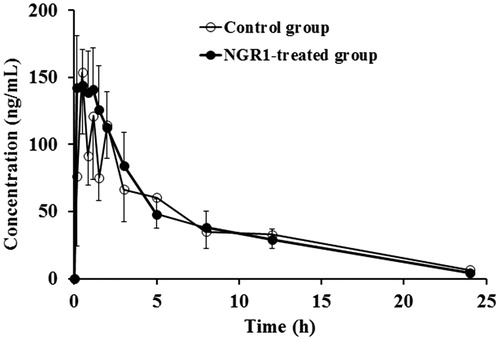
Figure 2. Mean plasma concentration–time profiles of caffeine in rats after intraperitoneal administration of 10 mg/kg caffeine in the blank control group and the NGR1-treated group.
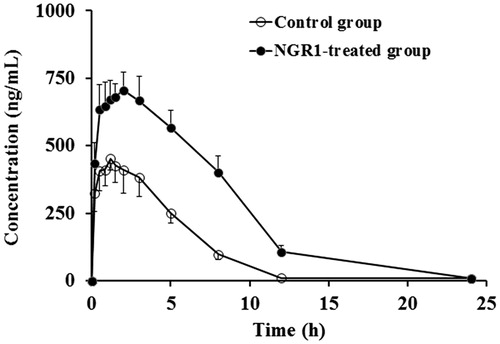
Table 2. Pharmacokinetic parameters of caffeine, tolbutamide, metoprolol, and dapsone after intraperitoneal administration to rats pretreated with physiological saline or NGR1.
Figure 3. Mean plasma concentration–time profiles of tolbutamide in rats after intraperitoneal administration of 15 mg/kg tolbutamide in the blank control group and the NGR1-treated group.
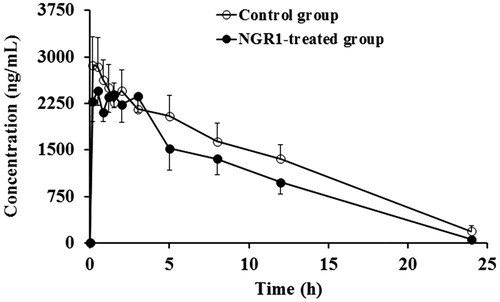
Figure 4. Mean plasma concentration–time profiles of metoprolol in rats after intraperitoneal administration of 20 mg/kg metoprolol in the blank control group and the NGR1-treated group.
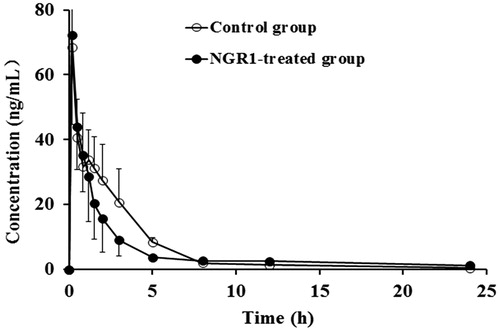
Figure 5. Mean plasma concentration–time profiles of dapsone in rats after intraperitoneal administration of 10 mg/kg dapsone in the blank control group and the NGR1-treated group.