Figures & data
Figure 1. Mean systemic arterial pressure (MSAP) in different experimental groups at the end of the 4th week. Values are mean ± SEM. n = 7–8. The differences in data were not significant. CTL, control group; B50, 50 mg/kg barberry extract; B100, 100 mg/kg barberry extract; B200, 200 mg/kg barberry extract; M, monocrotaline group; MB50, monocrotaline + 50 mg/kg barberry extract; MB100, monocrotaline + 100 mg/kg barberry extract; MB200, monocrotaline + 200 mg/kg barberry extract; Msil, monocrotaline + 30 mg/kg sildenafil.
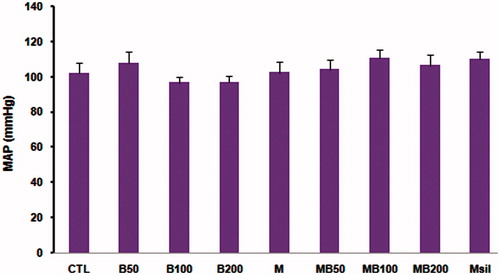
Figure 2. Right ventricular systolic pressure (RVSP) in different experimental groups (mm Hg) in all groups at the end of the 4th week. Values are mean ± SEM. n = 7–8. ***p < 0.001 compared with CTL, B50, B100, and B200 groups. #p < 0.01 compared with M and MB200 groups. ‡p < 0.001 compared with the M group. •p < 0.001 compared with the M group. ○p < 0.01 compared with the M group. RVSP increased in the monocrotaline group compared with other groups and barberry extracts (50, 100, and 200 mg/kg) dose dependently reduced this parameter. CTL, control group; B50, 50 mg/kg barberry extract; B100, 100 mg/kg barberry extract; B200, 200 mg/kg barberry extract; M, monocrotaline group; MB50, monocrotaline + 50 mg/kg barberry extract; MB100, monocrotaline + 100 mg/kg barberry extract; MB200, monocrotaline + 200 mg/kg barberry extract; Msil, monocrotaline + 30 mg/kg sildenafil.

Figure 3. Right ventricular hypertrophy index. Data are presented as mean ± SEM. n = 7–8. *p < 0.05 compared with CTL and B100 groups. #p < 0.01 compared with the B200 group. †p < 0.01 compared with the M group. •p < 0.05 compared with the M group. RVH increased in the monocrotaline group. Two weeks consumption of barberry extracts attenuated this parameter especially in dose of 200 mg/kg. CTL, control group; B50, 50 mg/kg barberry extract; B100, 100 mg/kg barberry extract; B200, 200 mg/kg barberry extract; M, monocrotaline group; MB50, monocrotaline + 50 mg/kg barberry extract; MB100, monocrotaline + 100 mg/kg barberry extract; MB200, monocrotaline + 200 mg/kg barberry extract; Msil, monocrotaline + 30 mg/kg sildenafil.
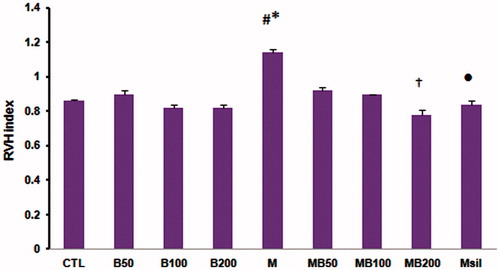
Figure 4. Medial wall thickness of pulmonary arterioles (µm). Data are presented as mean ± SEM. n = 7–8, ***p < 0.001 compared with CTL and B200 groups. *p < 0.05 compared with the M group. ‡p < 0.001 compared with Msil and M groups. Medial wall thickness of pulmonary arteriols significantly decreased in MB200 compared with monocrotaline and Msil groups. CTL, control group; B200, barberry extract (200 mg/kg); M, monocrotaline group; MB200, monocrotaline plus barberry extract (200 mg/kg); Msil, monocrotaline plus sildenafil (30 mg/kg).
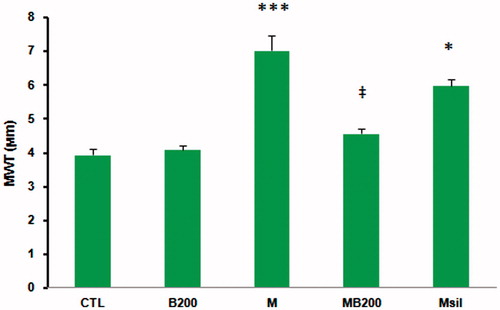
Figure 5. Arterioles of lung tissue of different animals group. (A) CTL group, (B) B200 group, (C) M group, (D) MB200 group, and (E) Msil group. Arterial wall thickness in monocrotaline group increased compared with other groups and two weeks consumption of barberry extract (200 mg/kg) attenuated this remodeling and its effect was stronger than 2 weeks consumption of sildenafil.
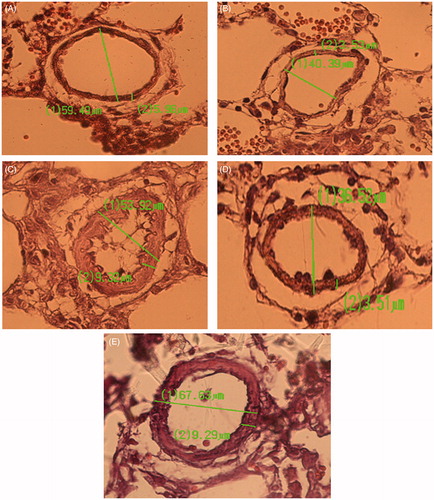
Figure 6. Serum Et-1 levels in experimental groups at the end of the 4th week. Data are presented as mean ± SEM. n = 6–7. ‡p < 0.001 compared with the CTL group. *p < 0.05 versus the B200 group, #p < 0.05 compared with the B200 group. •p < 0.01 compared with the CTL group. Barberry extract (200 mg/kg) and sildenafil (30 mg/kg) could not alter serum ET-1 level in the monocrotaline group. CTL, control group; B200, barberry extract (200 mg/kg); M, monocrotaline group; MB200, monocrotaline plus barberry extract (200 mg/kg); Msil, monocrotaline plus sildenafil (30 mg/kg).
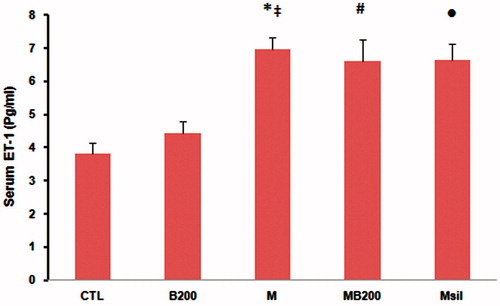
Figure 7. Lung ET-1 levels at the end of the 4th week in all groups. Values are mean ± SEM. Differences were not statistically significant. CTL, control group; B200, barberry extract (200 mg/kg); M, monocrotaline group; MB200, monocrotaline plus barberry extract (200 mg/kg); Msil, monocrotaline plus sildenafil (30 mg/kg).
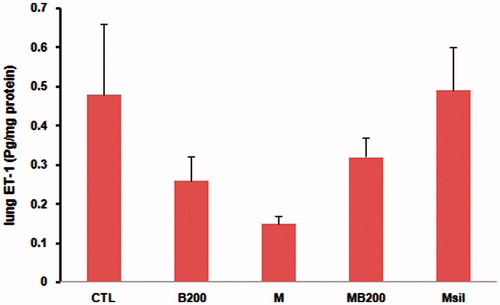
Figure 8. Glutation peroxidase (GPX) activity of lung tissue in different groups at the end of the 4th week. n = 6. Difference in data was not statistically significant. CTL, control group; B200, barberry extract (200 mg/kg); M, monocrotaline group; MB200, monocrotaline plus barberry extract (200 mg/kg); Msil, monocrotaline plus sildenafil (30 mg/kg).
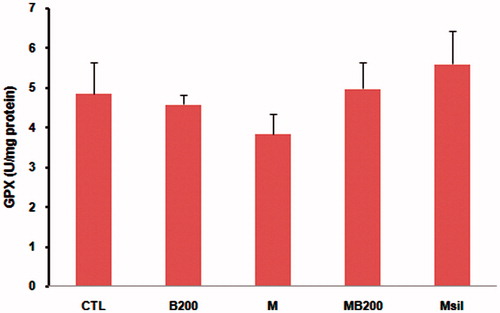
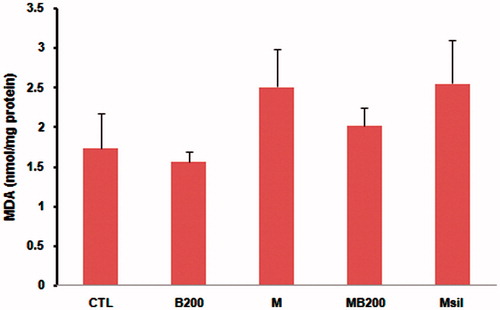
Figure 9. Malondialdehide (MDA) content of lung tissue at the end of the 4th week in all groups. n = 6. Difference in data was not statistically significant. CTL, control group; B200, barberry extract (200 mg/kg); M, monocrotaline group; MB200, monocrotaline plus barberry extract (200 mg/kg); Msil, monocrotaline plus sildenafil (30 mg/kg).