Figures & data
Table 1. 1H and 13C NMR data of dichapetalin X (1).
Table 2. Some 13C and 1H NMR (in C5D5N) signals of pomolic acid (3).
Table 3. 13C and 1H NMR data of glycerol monostearate (4).
Figure 1. Structures of dichapetalins X (1) and A (2).
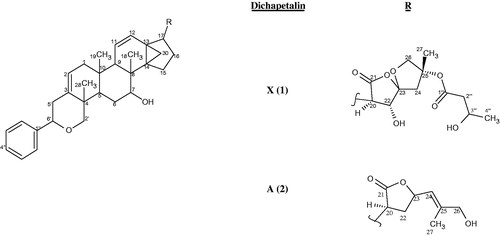
Figure 2. Some fragmentations observed in dichapetalin X (1).
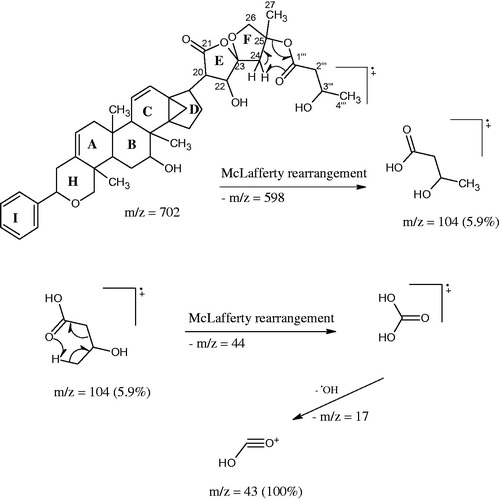
Figure 3. Structure of dichapetalin M.
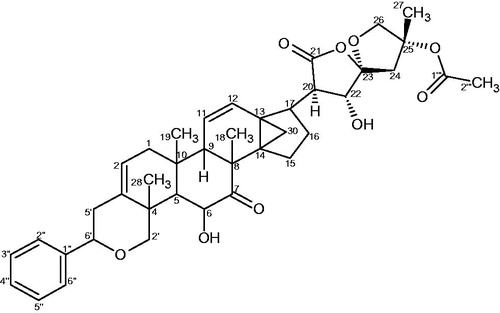
Figure 4. (a) Some HMBC interactions observed in 1. (b) Some NOEs observed in 1.
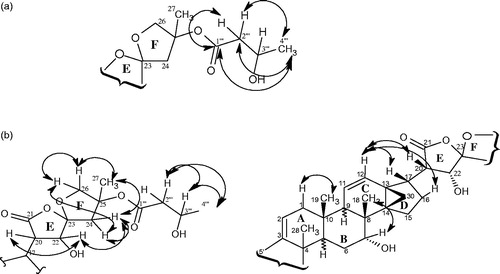
Figure 5. Structures of pomolic acid (3) and glycerol monostearate (4).
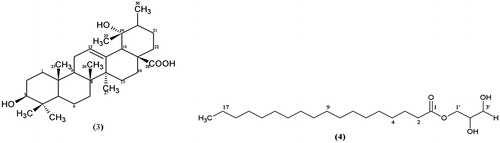
Table 4. In vitro average % EHI values at different concentrations of extracts, pure compounds, and albendazole.
Table 5. IC50 values (± SEM) for extracts (M, CA, and PE), pure compounds (Dichapetalin X, Dichapetalin A and Glycerol monostearate), and albendazole.
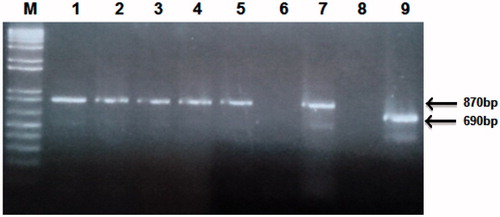
Figure 6. PCR identification of hookworm species. Lane M is the molecular weight marker, lanes 1–5 are genomic DNA of N. americanus eggs, lane 7 is the N. americanus positive control corresponding to 870 base pairs, lanes 6 and 8 are the two negative controls for the two species and lane 9 is the A. duodenale, positive control corresponding to 690 base pairs.