Figures & data
Table 1. Primers used in quantitative PCR analysis.
Figure 1. TGF-β peptide antagonist inhibited the gene expression of collagen I (COL I, A), collagen III (COL III, B), fibronectin (FN, C) and TGF-β1 (D) in HS fibroblasts. qPCR was employed to analyze the expression of various genes of the cells that were treated with peptide antagonist (peptide, 30 μM) and TGF-β type I/II receptor kinase inhibitor (LY2109761, 10 μM) or without treatment (control) for 48 h. The gene expression levels were presented relative to the control level. *p < 0.05 between control and LY2109761 groups; #p < 0.05 between control and peptide groups; &p < 0.05 between LY2109761 and peptide groups.
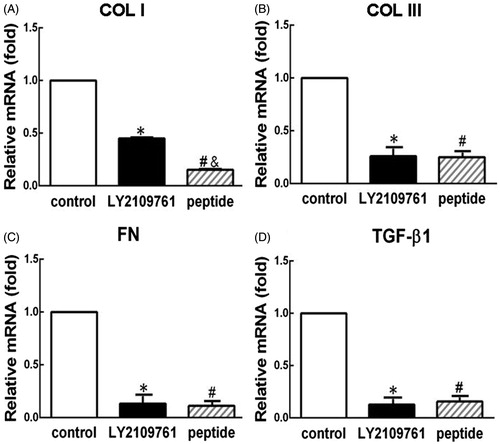
Figure 2. TGF-β peptide antagonist inhibited the protein production of collagen I (COL I, A), collagen III (COL III, B), fibronectin (FN, C), and TGF-β1 (D) in HS fibroblasts. Elisa was employed to analyze the protein production of various molecules from the cells that were treated with peptide antagonist (peptide, 30 μM) and TGF-β type I/II receptor kinase inhibitor (LY2109761, 10 μM) or without treatment (control) for 72 h. Fold changes relative to control were presented as the means of protein production levels among different groups. *p < 0.05 between control and LY2109761 groups; #p < 0.05 between control and peptide groups; &p < 0.05 between LY2109761 and peptide groups.
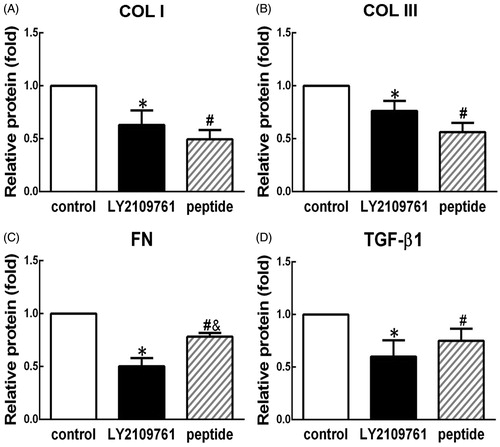
Figure 3. TGF-β peptide antagonist inhibited proliferation of HS fibroblasts. CCK-8 assay was employed to measure proliferation rate in the cells treated with peptide antagonist (peptide, 30 μM) and TGF-β type I/II receptor kinase inhibitor (LY2109761, 10 μM) or without treatment (control) at the time points of days 1, 2, 3, 4, and 5. *p < 0.05 between control and LY2109761 groups; #p < 0.05 between control and peptide groups.
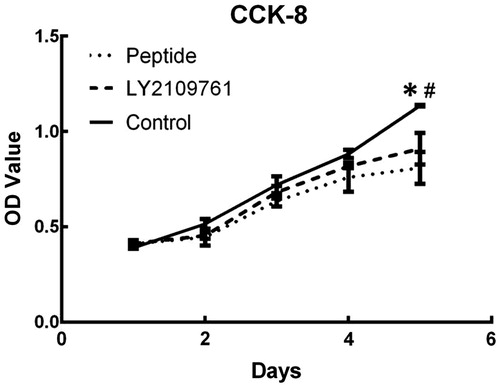
Figure 4. TGF-β peptide antagonist inhibited migration of HS fibroblasts. In vitro scratch wound assay was employed to measure cell migration rate, which was semi-quantified with Image pro-plus version 6.0 (Media Cybernetics, Silver Spring, MD). (A) Gross view of scratched and migrated areas at 24 h and 48 h for the cells treated with peptide antagonist (PEB, 30 μM) or TGF-β type I/II receptor kinase inhibitor (LY2109761, 10 μM) or without treatment (CTRL). (B) Semi-quantification of migration rate at 24 h post-wounding. (C) Semi-quantification of migration rate at 48 h post-wounding. *p < 0.05 between control and LY2109761 groups; #p < 0.05 between control and peptide groups; &p < 0.05 between LY2109761 and peptide groups.
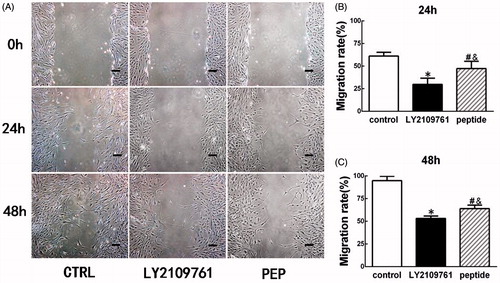
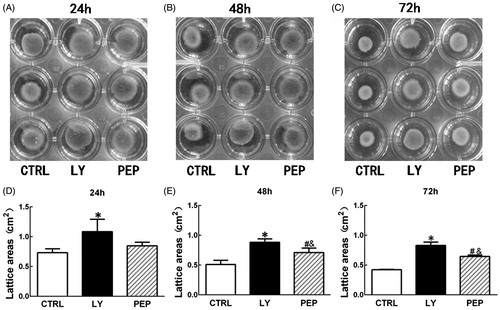
Figure 5. TGF-β peptide antagonist attenuated the contraction of HS fibroblast-populated collagen lattice (FPCL). FPCL contraction assay was employed to measure the contraction, and the contraction rate was semi-quantified with image software (Macropath 5, PRO, Guangzhou, China). (A–C) Gross view of FPCL contraction at the time points of 24 h, 48 h, and 72 h. (D–F) Semi-quantification of contraction rate of the cells treated with peptide antagonist (PEP, 30 μM) and TGF-β type I/II receptor kinase inhibitor (LY, 10 μM) or without treatment (CTRL). *p < 0.05 between control and LY2109761 groups; #p < 0.05 between control and peptide groups; &p < 0.05 between LY2109761 and peptide groups.