Figures & data
Figure 1. Microtubule morphology. (A) Microtubule structure is integral and no fracture is observed in the control group. (B) In the ischemia group, microtubule continuity is interrupted, and microtubule fracture can be seen. (C) In the 0.1 μM taxol group, microtubule structure is integral but disrupted (n = 10 per group). Magnification ×400; bar, 40 μm.
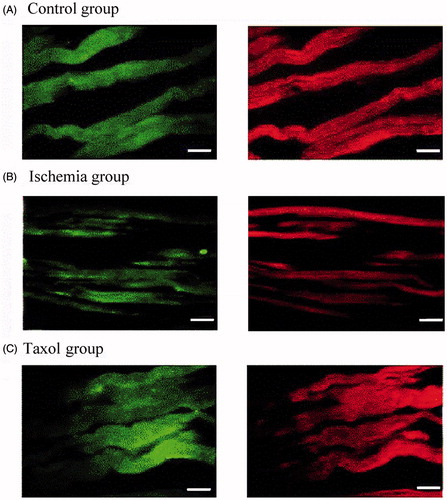
Figure 2. Taxol reduces the levels of reactive oxygen species (ROS) during ischemia. (A) Representative qualitative assessment of ROS (×400 magnification). Bar, 40 μm. (B) ROS level. Values are the mean ± SE (n = 15 per group). *p < 0.05 versus the control group; Δp < 0.05 versus the control group and the ischemia group; ∇p < 0.05 versus the control group, the ischemia group, and taxol (0.1 and 0.3 μM) groups.
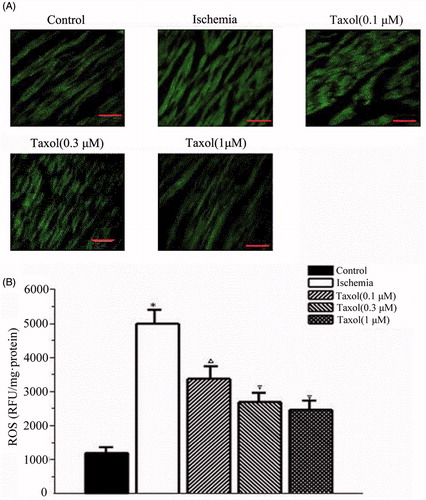
Figure 3. The expression of tubulin and HO-1 genes and the activity of all three subfamilies of MAPKs (ERK, JNK, and p38) in cardiomyocytes cells with taxol or colchicine treatment. (A) Representative western blot of tubulin and HO-1 gene expression and the activity of p-p38, p-JNK, and p-ERK in the ischemia group, the taxol group, and the colchicine group. (B) The histogram is the mean of densitometric analysis showing relative density units (RDU) of the western blot signals for genes normalized to control. All data represent mean ± SE (n = 10 per group). *p < 0.05 by Student’s t-test.
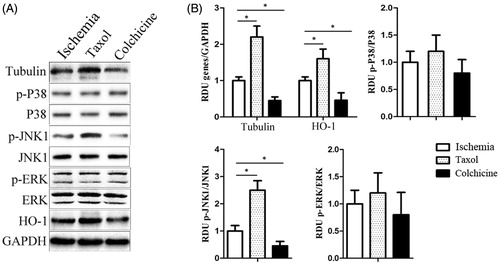
Table 1. Effects of taxol on the activities of oxidative enzymes (n = 15 per group).
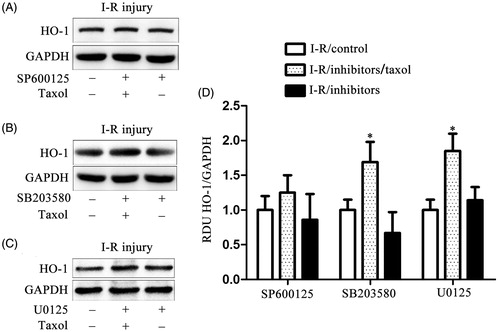
Figure 4. Taxol increases the expression of HO-1 gene via activating JNK in cardiomyocytes cells. (A) Representative western blot of HO-1 gene expression in cardiomyocytes cells incubated with U0125 (10 μM). (B) Representative western blot of HO-1 gene expression in cardiomyocytes cells incubated with SB203580 (10 μM). (C) Representative western blot of HO-1 gene expression in cardiomyocytes cells incubated with SP600125 (1 μM). (D) The quantification of the HO-1 gene expression for the western blot assay. All data represent mean ± SE (n = 10 per group). *p < 0.05 by Student’s t-test.