Figures & data
Figure 1. Temporal sequence of events in experimental protocol.
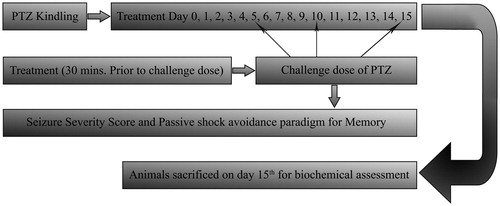
Figure 2. IC50 values of the Glycyrrhiza glabra flavonoid fraction in comparison with curcumin in three different tests.
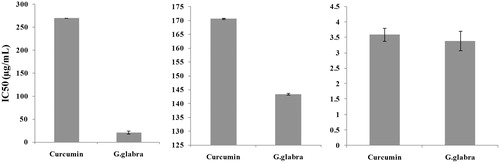
Figure 3. Effect of pharmacological interventions on seizure severity score. All values are represented as mean ± SEM; n = 6, ap < 0.05 as compared with PTZ-control; bp < 0.05 as compared with phenytoin per se. GGFF, Glycyrrhiza glabra flavonoid fraction.
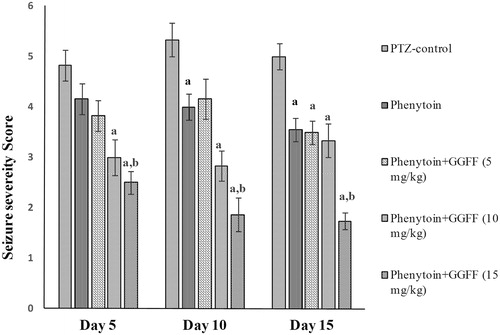
Figure 4. Effect of pharmacological interventions on number of mistakes. All values are represented as mean ± SEM; n = 6, ap < 0.05 as compared with naive, bp < 0.05 as compared with PTZ-control; cp < 0.05 as compared with phenytoin per se; a′p < 0.05 as compared with day 5. NM, no mistakes; GGFF, Glycyrrhiza glabra flavonoid fraction.
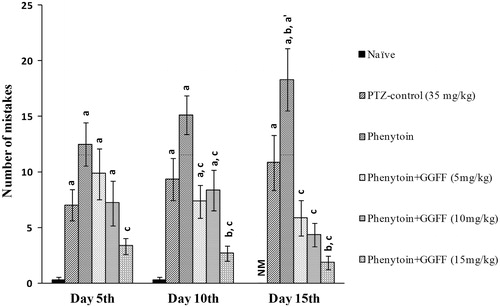
Figure 5. Effect of pharmacological interventions on step down latency. All values are represented as mean ± SEM; n = 6, ap < 0.05 as compared with naive, bp < 0.05 as compared with PTZ-control; cp < 0.05 as compared with phenytoin per se. a′p < 0.05 as compared with day 5. GGFF, Glycyrrhiza glabra flavonoid fraction.
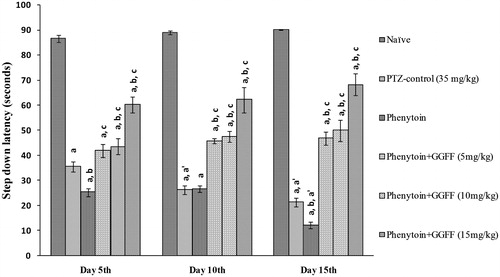
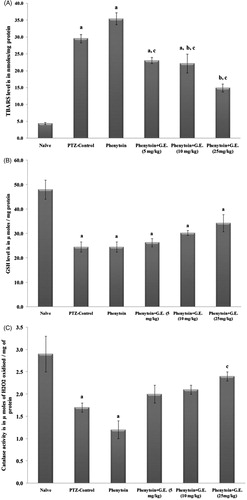
Figure 6. Effect of intervention of drugs on biochemical estimations. All values are represented as mean ± SEM; n = 6, ap < 0.05 as compared with the naive group; bp < 0.05 as compared with PTZ-control; cp < 0.05 as compared with phenytoin per se. (A) TBARS level in nmoles/mg protein; (B) GSH level in µ moles/mg protein; (C) catalase activity in µ moles of H2O2 oxidized/mg of protein. TBARS, thiobarbituric acid reactive substances; GSH, reduced glutathione; CAT, catalase; GGFF, Glycyrrhiza glabra flavonoid fraction.