Figures & data
Table 1. The Box–Behnken experimental design with the independent variables (actual and coded values).
Table 2. Analysis of variance for the fitted quadratic polynomial model of extraction of lyoniside.
Table 3. Estimated regression model of the relationship between extraction yield of lyoniside and independent variables (A, B, C).
Figure 1. Response surface plot and contour plot showing the effect of solvent ratio (A) and material solvent ratio (B) on lyoniside content.
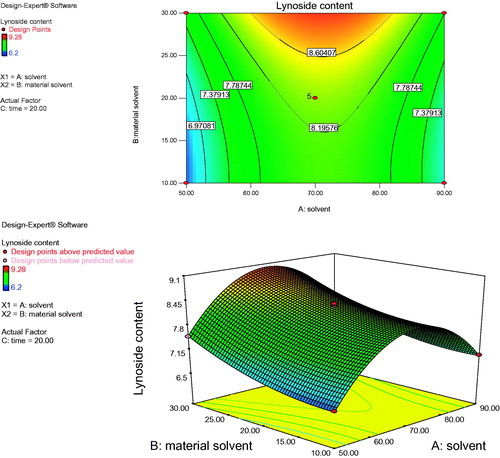
Figure 2. Response surface plot and contour plot showing the effect of solvent ratio (A) and time (C) on lyoniside content.
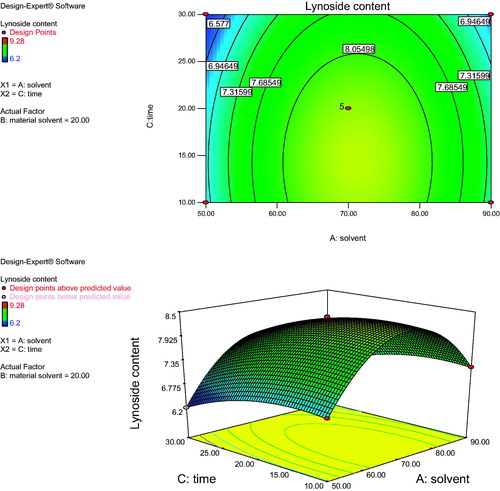
Figure 3. Response surface plot and contour plot showing the effect of material solvent ratio (B) and time (C) on lyoniside content.
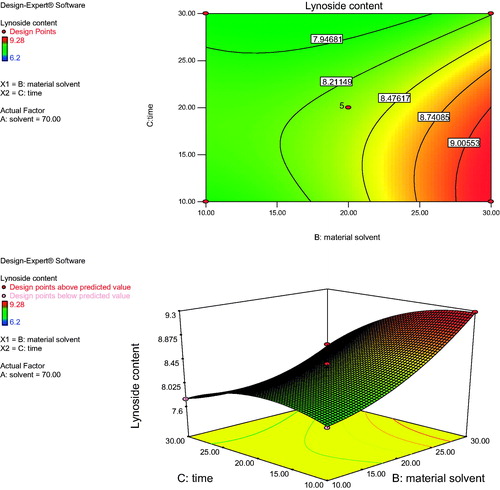
Figure 4. HPLC chromatogram of optimized extract and structure of lyoniside.
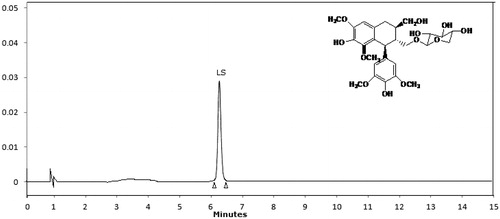
Figure 5. Mass spectra of lyoniside.
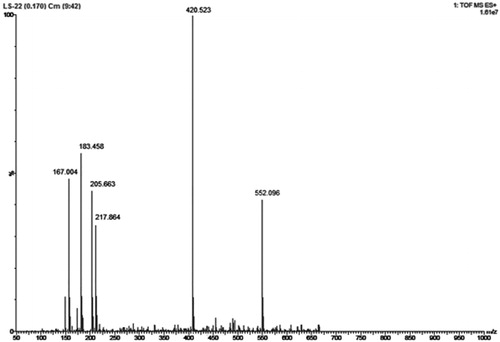
Table 4. Optimum conditions and the predicted and experimental yield at the optimum conditions.
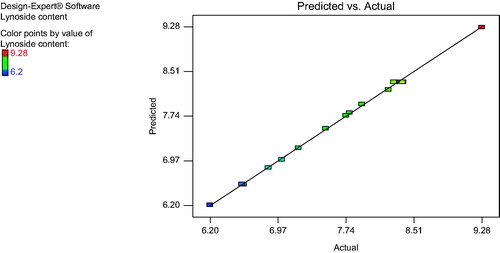
Figure 6. Correlation plot between the actual and predicted yield of lyoniside content.