Figures & data
Table 1. Effect of chronic administration of B. dracunculifolia extract in biochemical and biometric parameters in rats from the induced-obesity model.
Figure 1. Blood glucose levels (A) and area under the curve during the glucose oral tolerance test (B) in the studied groups. Values are presented as mean ± EPM (n = 8). Different letters indicate statistically significant difference between groups (p < 0.05; Bonferroni test after one-way ANOVA).
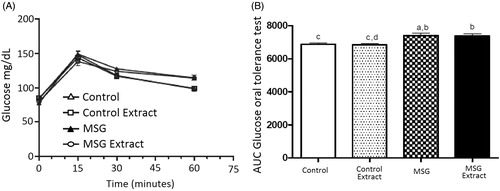
Figure 2. Plasma (A) insulin, and (B) HOMAir score [insulin (μU/mL) × glycemia (mmol/L)/22.5] in the studied groups. The values are presented as mean ± EPM (n = 8). Different letters indicate statistically significant difference between groups (p < 0.05; Bonferroni test after one-way ANOVA).
![Figure 2. Plasma (A) insulin, and (B) HOMAir score [insulin (μU/mL) × glycemia (mmol/L)/22.5] in the studied groups. The values are presented as mean ± EPM (n = 8). Different letters indicate statistically significant difference between groups (p < 0.05; Bonferroni test after one-way ANOVA).](/cms/asset/23a89580-d5ed-479d-8a34-dc4094cc963b/iphb_a_1067232_f0002_b.jpg)
Figure 3. Glucose-induced insulin secretion (A) MSG treatment; (B) 30 days of oral administration of B. dracunculifolia extract solution; (C) MSG-obese rats treated with B. dracunculifolia extract solution. The values are presented as mean ± EPM. Symbols above bars represent statistical difference only for *p < 0.05 in the analysis of variance.
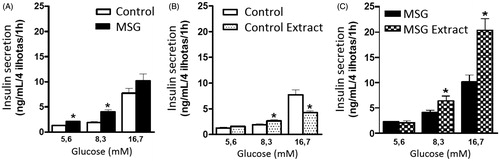
Figure 4. Effects of oral administration of B. dracunculifolia extract solution on the morphology of pancreatic islets from MSG-obese rats. Photomicrograph representative of pancreatic islets (left) stained with hematoxylin–eosin (H&E). Morphometric evaluations of the area with islets in all groups were analyzed and their respective values presented as mean ± SEM in the graphic (right). Symbols above bars represent statistical difference of p < 0.05 in the Student’s t-test. *CON versus MSG; •MSG versus MSG Extract.
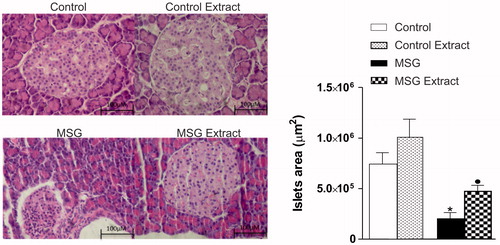
Figure 5. Extraction of bioactive from B. dracunculifolia plant extract with: *ethanol, **methanol, ***acetone.
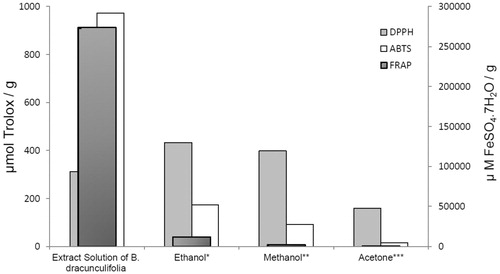
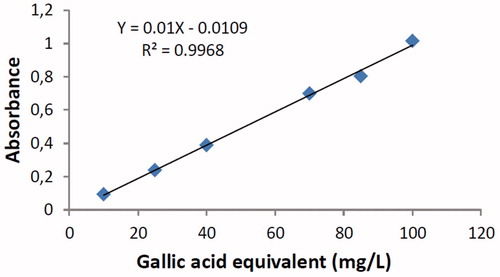
Figure 6. Standard curve plot of gallic acid.