Figures & data
Figure 1. Effect of MAG on serum AST, ALT, TBIL, DBIL, IBIL, and TBA activities in control, RIF + INH, MAG low-dose, and MAG high-dose groups. RIF + INH group: co-administered with RIF (60 mg/kg) and INH (60 mg/kg). MAG low-dose group: co-administered with MAG at 45 mg/kg and RIF/INH at 60/60 mg/kg. MAG high-dose group: co-administered with MAG at 90 mg/kg and RIF/INH at 60/60 mg/kg. Data are shown as mean ± SD. Each group at each time point contained at least five rats. Δp < 0.05 versus the control group; ΔΔp < 0.01 versus the control group; *p < 0.05 versus the RIF + INH group; **p < 0.01 versus the RIF + INH group.
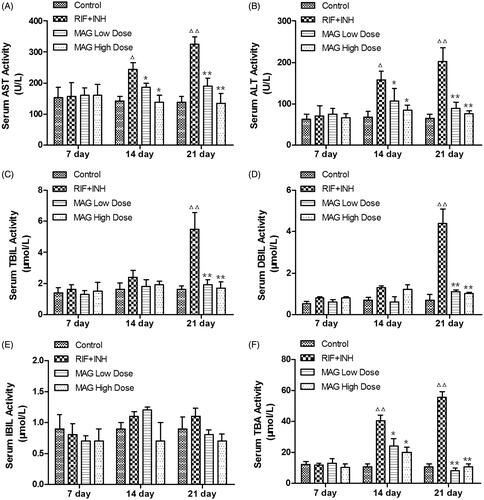
Figure 2. Histopathology changes of control, RIF + INH, MAG low-dose, and MAG high-dose groups after treated for 7, 14, and 21 d. (A) Photomicrography of liver sections; (B) statistical analysis of HAI (histological activity index) scores. ① acidophilic and pyknosis ② inflammation and necrosis ③ fatty degeneration. Images of all groups were taken at ×200 magnification. Data are shown as mean ± SD. Each group at each time point contained five rats. Δp < 0.05 versus the control group; ΔΔp < 0.01 versus the control group; *p < 0.05 versus the RIF + INH group; **p < 0.01 versus the RIF + INH group.
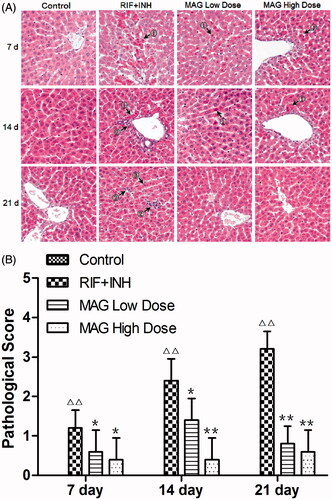
Figure 3. Effect of MAG on GSH and MDA levels in control, RIF + INH, MAG low-dose, and MAG high-dose treated groups. RIF + INH group: co-administered with RIF (60 mg/kg) and INH (60 mg/kg). MAG low-dose group: co-administered with MAG (45 mg/kg) and RIF/INH at 60/60 mg/kg. MAG high-dose group: co-administered with MAG (90 mg/kg) and RIF/INH at 60/60 mg/kg. Data are shown as mean ± SD. Each group at each time point contained five rats. Δp < 0.05 versus the control group; ΔΔp < 0.01 versus the control group; *p < 0.05 versus the RIF + INH group; **p < 0.01 versus the RIF + INH group.
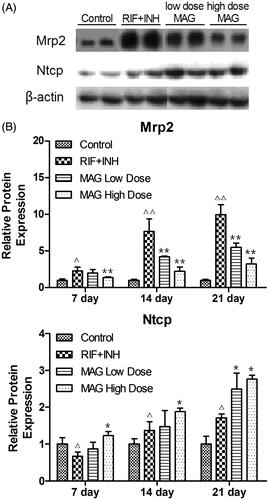
Figure 4. Western blot analysis of Mrp2 and Ntcp from the rats of the control, RIF + INH, MAG low-dose, and MAG high-dose groups. (A) The representative western immunoblots of Mrp2 and Ntcp at 21-d time point; (B) the statistical analysis of mean relative protein expression (normalized to control rats). Each group at each time point contained at least five rats. Δp < 0.05 versus the control group; ΔΔp < 0.01 versus the control group; *p < 0.05 versus the RIF + INH group; **p < 0.01 versus the RIF + INH group.
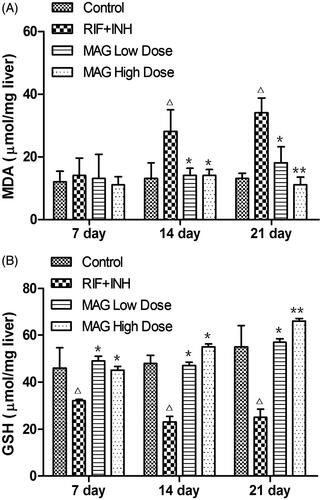
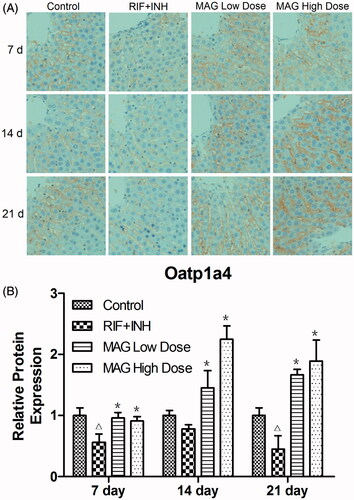
Figure 5. Immunohistochemical images and statistical results of Oatp1a4 in liver tissue from rats of the control, RIF + INH, MAG low-dose, and MAG high-dose groups. The data were presented as representative pictures (A) and as mean relative Oatp1a4 protein expression ± SD (B). Each group at each time point contained at least 15 immunohistochemistry images. Δp < 0.05 versus the control group; ΔΔp < 0.01 versus the control group; *p < 0.05 versus the RIF + INH group; **p < 0.01 versus the RIF + INH group.