Figures & data
Figure 1. Chemical structure of 20-O-d-glucopyranosyl-20(S)-protopanaxadiol.
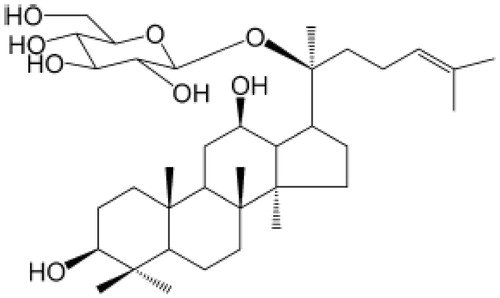
Figure 2. CK attenuated severity of arthritis of AA rats. SD rats were immunized with CFA at day 0. After the onset of arthritis, AA rats were divided into five groups and treated intragastrically with CK (once a day) or MTX (once 3 d) from day 15 to day 29. The arthritis global assessment (A) and swollen joint count (B) were evaluated. Data are expressed as mean ± SD from 10 animals for each group. *p < 0.05, **p < 0.01 versus the AA group.
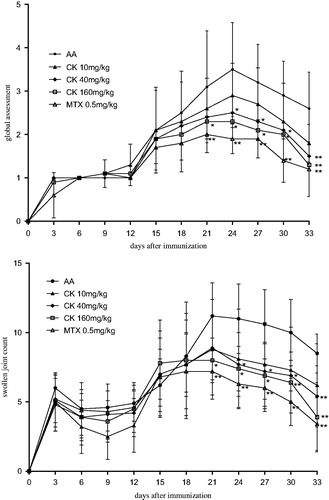
Figure 3. Effect of CK on spleen index of AA rats. Data are expressed as mean ± SD from 10 animals for each group. **p < 0.01 versus the AA group.
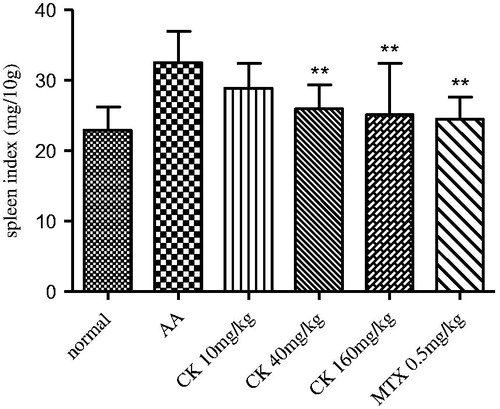
Figure 4. Effect of CK on histopathology of spleen in AA rats. (A) Photomicrograph (original magnification, ×100, H&E stain) of spleen show hyperplasia of LN (horizontal arrow) and MZ (vertical arrow). (B) Histopathological scores of spleen were evaluated. Data are expressed as mean ± SD from six animals for each group. *p < 0.05, **p < 0.01 versus the AA group.
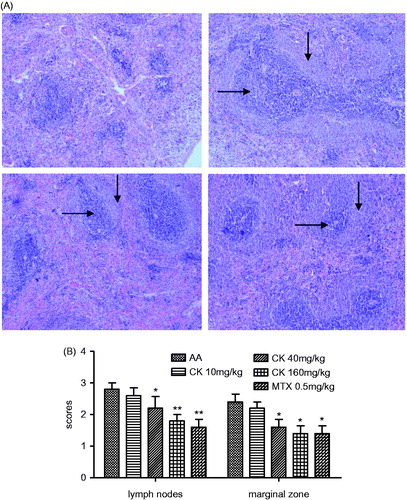
Figure 5. CK regulated B cell subsets in spleen of AA rats. Subsets of B cells including CD45R + IgM + (total B cells) and CD45R + CD27 + (memory B cells) were assayed by flow cytometry. (A and C) CD45R + CD27 + memory B cells, (B, D) CD45R + IgM + total B cells. Data are expressed as mean ± SD from six animals for each group. #p < 0.05, ##p < 0.01 versus the normal group; *p < 0.05, **p < 0.01 versus the AA group.
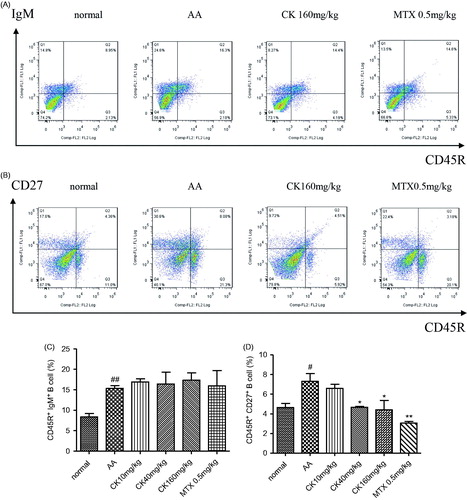
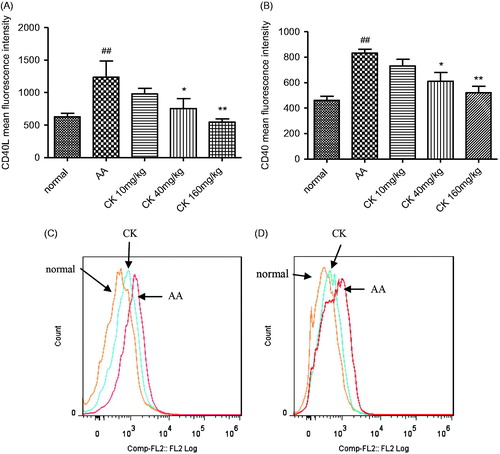
Figure 6. CK suppressed CD40L expression on T cells and CD40 expression on B cells. (A, B) The expression of CD40L on T cell and CD40 expression on B cells was evaluated by flow cytometry. (C, D) The representative flow cytometry histogram. Data are expressed as mean ± SD. ##p < 0.01 versus the normal group; *p < 0.05, **p < 0.01 versus control. The results are representative of at least three independent experiments.