Figures & data
Figure 1. Chemical structures of the compounds identified in GC–MS.
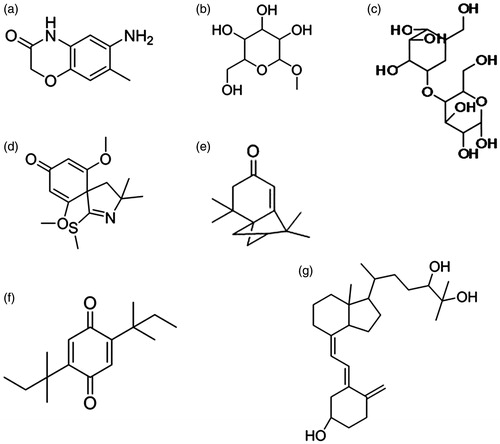
Table 1. Major compounds obtained from GC–MS analyses of the LP extract.
Table 2. Serum parameters of LP extract supplemented and control rats.
Table 3. Haematological parameters of LP extract supplemented and control rats.
Table 4. Effect of LP extract on urinary parameters of control and experimental groups.
Table 5. Effect of LP extract on serum parameters of control and experimental groups.
Figure 2. Effects of LP extract on tissue antioxidant enzymes. (a) Superoxide dismutase (SOD); (b) catalase, and (c) lipid peroxidation. The values are expressed as mean ± SD. The results were statistically analyzed by one-way ANOVA with Bonferroni’s multiple comparison post test (n = 6). The comparisons were made as ‘a’ – Group 1 versus Group 2; ‘b’ – Group 2 versus Groups 3; ‘c’ – Group 2 versus Groups 4. ***p < 0.001, **p < 0.01, *p < 0.05.
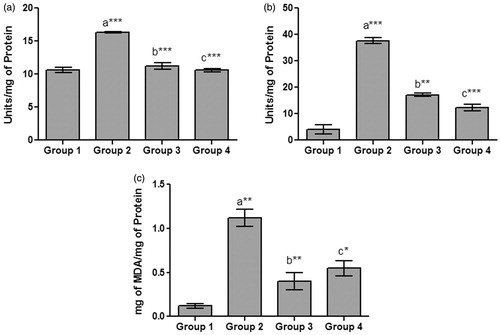
Figure 3. Figure shows kidney sections of control and various experimental groups stained with haematoxylin and eosin and Von Kossa (×400).
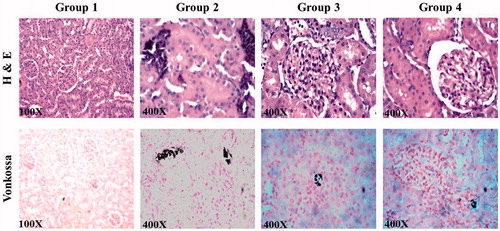
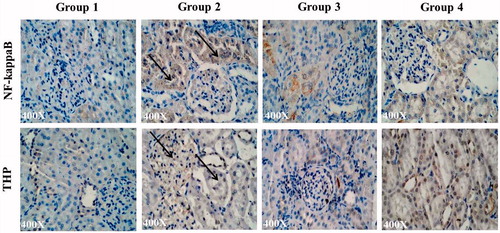
Figure 4. Figure shows immunohistochemical expression of NF-κB and THP in control and various experimental groups (×400).