
Figures & data
Figure 1. Cytotoxicity of t-BHP and GTs on cultured human hepatoma HepG2 cells. Relative cell viability was measured by the MTT assay. (A) HepG2 cells were treated with different concentrations of t-BHP (10, 20, 40, 60, 80, 100 and 150 μmol/L) for 4 h. (B) HepG2 cells were treated with various concentrations of GTs (50, 100, 200, 400, 800 and 2000 μg/ml) for 4 h. Relative cell viability was calculated according to the formula. All data are expressed as the means ± SD (error bars) of values from three independent experiments. *p < 0.05 and **p < 0.01 were considered significant versus the control group.
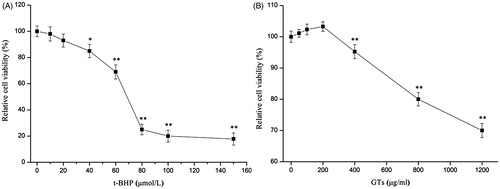
Figure 2. Evaluation of the cytoprotective effect of GTs by MTT assay and morphological observation. (A) HepG2 cells were pretreated with indicated concentrations of GTs for 4 h, and then incubated with or without 60 μmol/L of t-BHP for a further 4 h. Relative cell viability was calculated according to the formula. (B) Morphological alterations to HepG2 cells, pretreated with indicated concentrations of GTs for 4 h, and then incubated with or without 60 μmol/L of t-BHP for a further 4 h. (a and b) Little cell death was observed in the control (Con.) and the MNCC group. (c) The amount of HepG2 cells diminished dramatically in the model group. (d–f) The number of cells significantly increased in a dose-dependent manner, when HepG2 cells were pretreated with 50 (L-d., low-dose group), 100 (M-d., medium-dose group) and 200 μg/ml (H-d., high-dose group) of GTs for 4 h compared with 0 μg/ml (Mod., model group) of GTs. Cell morphology was assessed by using an Olympus inverted phase contrast microscope (200×) (Olympus Corporation, Center Valley, PA). All data are expressed as the means ± SD (error bars) of values from three independent experiments. *p < 0.05 and **p < 0.01 were considered significant versus the model group. #p < 0.05 and ##p < 0.01 were considered significant versus the control group.
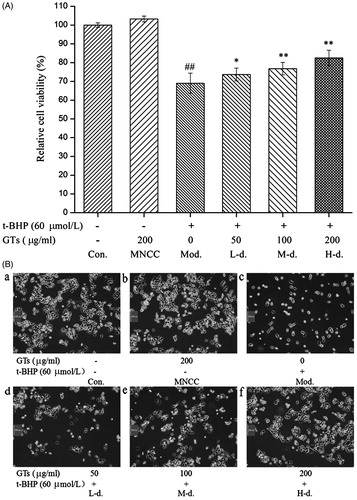
Figure 3. GTs decreased the up-regulation of ALT, AST, LDH and MDA and increased the down-regulation of GSH and SOD induced by t-BHP in HepG2 cells. HepG2 cells were pretreated with indicated concentrations of GTs for 4 h, and then incubated with or without 60 μmol/L of t-BHP for a further 4 h. The leakage of ALT (A), AST(B) and LDH (C) released by HepG2 cells was measured in the culture supernatant. Hepatocellular (D) GSH, (E) MDA and (F) SOD were assessed from HepG2 cell lysates. All data are expressed as the means ± SD (error bars) of values from three independent experiments. *p <0.05 and **p <0.01 were considered significant versus the model group; #p <0.05 and ##p <0.01 were considered significant versus the control group.
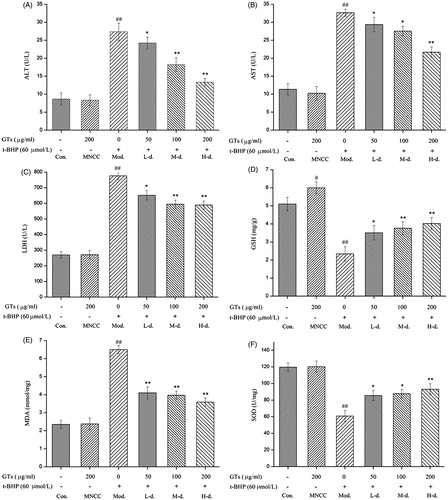
Figure 4. TIC of GTs and ganoderic acid A.
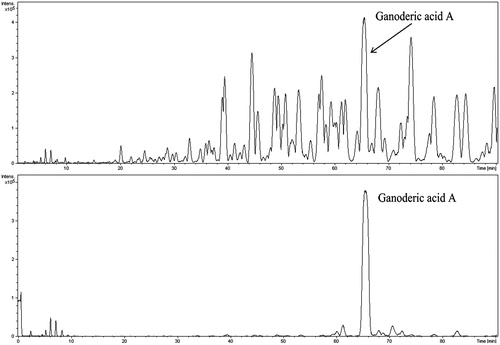
Table 1. Characterisetion of chemical constituents in GTs by HPLC/Q-TOF-MS.