Figures & data
Table 1. The primers of CDR1, CDR2, MDR1, and ACT1 for qRT-PCR.
Figure 1. Time–kill curves of Ca 215, Ca z2003, and Ca z1110 after the treatments of no drugs (control), 32 μg/mL FLC, 128 μg/mL KAE, 32 μg/mL FLC + 128 μg/mL KAE, those of Ca z1007 and Ca 2019 after the treatments of no drugs (control), 16 μg/mL FLC, 128 μg/mL KAE, 16 μg/mL FLC + 128 μg/mL KAE, those of Ca 2144 and Ca 2209 after the treatments of no drugs (control), 32 μg/mL FLC, 256 μg/mL KAE, 32 μg/mL FLC + 256 μg/mL KAE, that of Ca z1105 after the treatments of no drugs (control), 2 μg/mL FLC, 128 μg/mL KAE, 2 μg/mL FLC + 128 μg/mL KAE, that of Ca sp1927 after the treatments of no drugs (control), 1 μg/mL FLC, 256 μg/mL KAE, 1 μg/mL FLC + 256 μg/mL KAE, and that of Ca SC5314 after the treatments of no drugs (control), 0.25 μg/mL FLC, 128 μg/mL KAE, 0.25 μg/mL FLC + 128 μg/mL KAE. FLC, fluconazole; KAE, kaempferol.
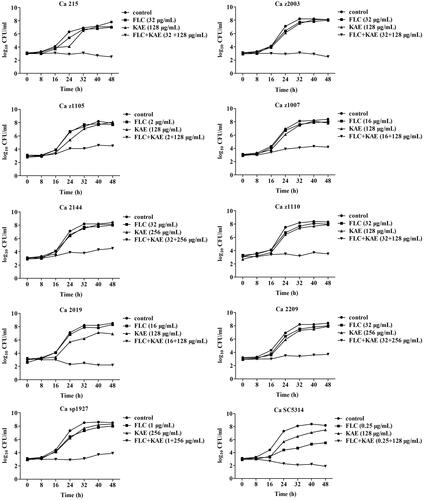
Figure 2. Scanning electron microscope of Ca z2003 after the treatment of (A) no drugs (control), (B) 32 μg/mL FLC, (C) 128 μg/mL KAE, and (D) 32 μg/mL FLC + 128 μg/mL KAE. Bar: 20 μm. FLC, fluconazole; KAE, kaempferol.
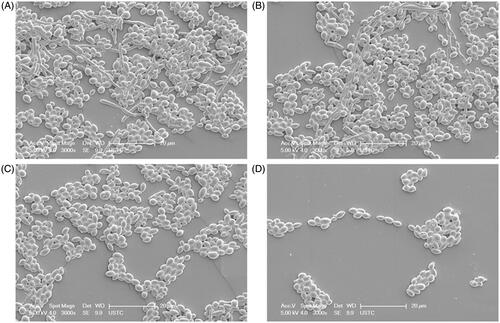
Table 2. Interactions between FLC and KAE alone and in combination against Candida albicans strains.
Figure 3. Effluxes of rhodamine-6G after the treatments of (A) no drugs (control), (C) 32 μg/mL FLC, (E) 128 μg/mL KAE, (G) 32 μg/mL FLC + 128 μg/mL KAE at light field, and of (B) no drugs (control), (D) 32 μg/mL FLC, (F) 128 μg/mL KAE, (H) 32 μg/mL FLC + 128 μg/mL KAE at an excitation wavelength of 525 nm and an emission wavelength of 550 nm on Ca z2003. FLC, fluconazole; KAE, kaempferol.
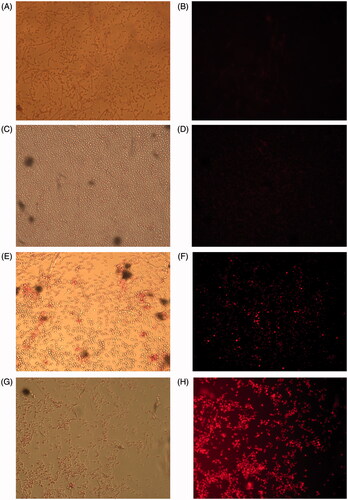
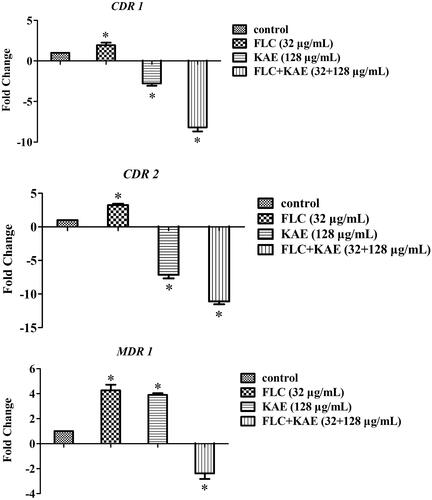
Figure 4. The fold changes of CDR 1 (up), CDR 2 (middle), and MDR 1 (bottom) by qRT-PCR after the treatments of no drugs (control), 32 μg/mL FLC, 128 μg/mL KAE, and 32 μg/mL FLC + 128 μg/mL KAE on Ca z2003. *p <0.05, compared with the control. FLC, fluconazole; KAE, kaempferol.