Figures & data
Figure 1. HPLC chromatogram showing phenolic acids available in Morus nigra. [1: Vanillic acid, Rt (minute): 14.011, source of confirmation: UV, 2: chlorogenic acid, Rt (minute): 16.163, IS, internal standard, Rt (minute): 53.974].
![Figure 1. HPLC chromatogram showing phenolic acids available in Morus nigra. [1: Vanillic acid, Rt (minute): 14.011, source of confirmation: UV, 2: chlorogenic acid, Rt (minute): 16.163, IS, internal standard, Rt (minute): 53.974].](/cms/asset/78025087-6e58-4dba-a374-5537acb0dc17/iphb_a_1101476_f0001_c.jpg)
Figure 2. Electrophoretic pattern of pBR322 plasmid DNA after treatment with UV and H2O2 in the presence of Morus nigra aqueous extract. Addition of 0.02, 0.04, and 0.05 mg/mL M. nigra to the reaction mixture conferred the significant protection to the damage of all DNA bands; lanes 7, 8, and 9. Lane 1: plasmid DNA (3 μL) + dH2O (6 μL), lane 2: plasmid DNA (3 μL) + dH2O (6 μL) + UV, lane 3: plasmid DNA (3 μL) + dH2O (6 μL) + UV + H2O2 (1 μL), lane 4: plasmid DNA (3 μL) + dH2O (6 μL) + H2O2 (1 μL), lane 5: plasmid DNA (3 μL) + aqueous extract (0.005 mg/mL) (5 μL) + + UV + H2O2 (1 μL), lane 6: plasmid DNA (3 μL) + aqueous extract (0.01 mg/mL) (5 μL) + + UV + H2O2 (1 μL), lane 7: plasmid DNA (3 μL) + aqueous extract (0.02 mg/mL) (5 μL) + + UV + H2O2 (1 μL), lane 8: plasmid DNA (3 μL) + aqueous extract (0.04 mg/mL) (5 μL) + + UV + H2O2 (1 μL), lane 9: plasmid DNA (3 μL) + aqueous extract (0.05 mg/mL) (5 μL) + + UV + H2O2 (1 μL).
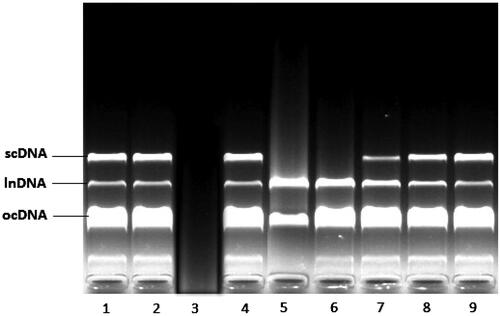
Figure 3. Effect of M. nigra on the escape latency of d-galactose-treated mice in the Morris water maze test. Escape latencies to find a hidden platform in the water maze during 4 consecutive days training. d-Galactose was dissolved in sterile saline (0.3 mL) and injected subcutaneously (100 mg/kg/d, s.c.) for 60 continuous days and control group were treated with the same volume of sterile saline. The d-galactose + M. nigra group mice were orally administered with lyophilized M. nigra extract at the doses of 50 and 100 mg/kg/d respectively after injection of d-galactose (100 mg/kg/d, s.c.). Data are expressed as mean ± S.D. (n = 8 in each group). **p <0.01 compared with the control group; ##p <0.01 to the d-galactose group.
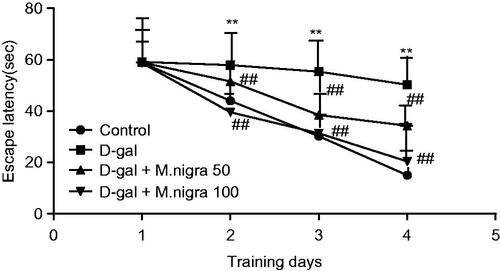
Figure 4. Effect of M. nigra on behavior of d-galactose-treated mice in the Morris water maze test. d-Galactose was dissolved in sterile saline (0.3 mL) and injected subcutaneously (100 mg/kg/d, s.c.) for 60 continuous days and the control group was treated with the same volume of sterile saline. d-galactose + M. nigra group mice were orally administered with lyophilized M. nigra extract at the doses of 50 and 100 mg/kg/d respectively after injection of d-galactose (100 mg/kg/d, s.c.). Data are expressed as mean ± S.D. (n = 8 in each group). (A) Comparison of the time required to reach the target quadrant on day 5, (B) comparison of the time spent in the target quadrant on day 5, (C) comparison of numbers of crossing over platform site on day 5. **p <0.01 compared with the control group; ##p <0.01, #p <0.05 compared with the d-galactose group.
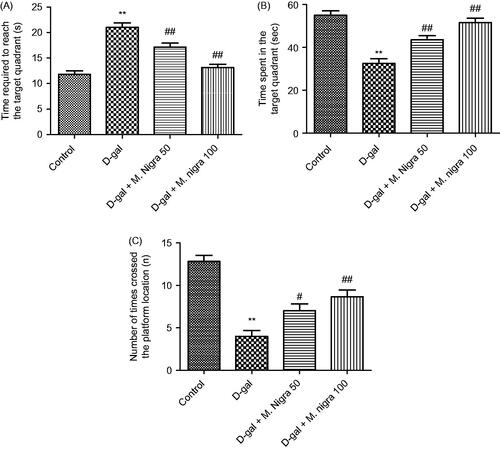
Figure 5. Effect of M. nigra on the levels of MDA in serum, brain, and liver of d-galactose-treated mice. Data are expressed as mean ± S.D. (n = 8 in each group). **p <0.01, compared with the control group; ##p <0.01, #p <0.05 compared with the d-galactose group.
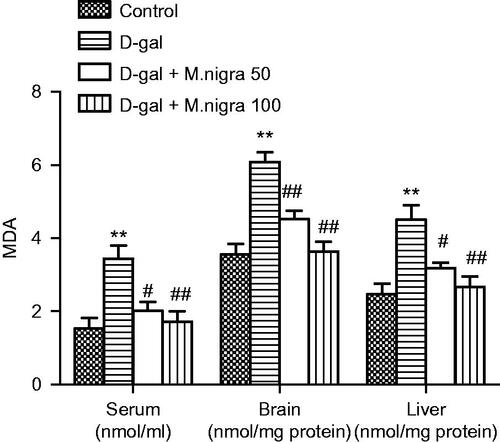
Figure 6. Effect of M. nigra on the activities of SOD, GSH-Px, and CAT in serum, brain, and liver tissue of d-galactose-treated mice. Data are expressed as mean ± S.D. (n = 8 in each group). **p <0.01, *p <0.05 compared with the control group; ##p <0.01, #p <0.05 compared with the d-galactose group.
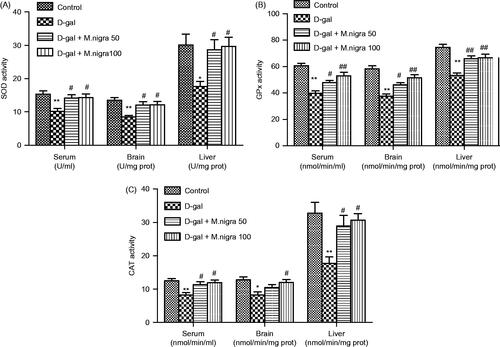
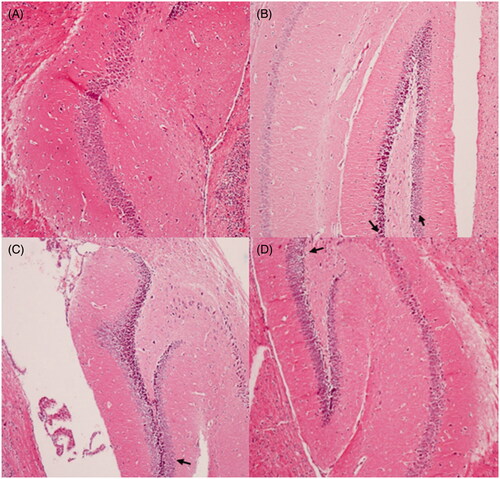
Figure 7. Protective effects of M. nigra against d-galactose induced cell loss in the hippocampus of mice revealed by hematoxylin and eosin (H&E, ×100) staining. (A) Control group: the neurons are full and arranged tightly, the nuclei are light stained; (B) d-galactose group: focal disappearance of neurons and red neurons, as the arrows pointed neurodegeneration was evident (neurons are shrunken, the nuclei are side moved and dark stained); (C) d-galactose + M. nigra 50 group: one red neuron observed; neurodegeneration reduced as the arrow marked; (D) d-galactose + M. nigra 100 group: one red neuron observed the neurons normalize, the nuclei are light stained and arranged tightly and neurodegeneration was attenuated significantly.