
Figures & data
Figure 1. A GC-FID chromatogram and structures of main metabolites recovered after biotransformation of (R)-(+)-limonene by M. minutissima; IS, internal standard (A). Main products and a GC-FID chromatogram of the post-reaction mixture after (−)-α-pinene biotransformation by C. pannorum. IS, internal standard (B).
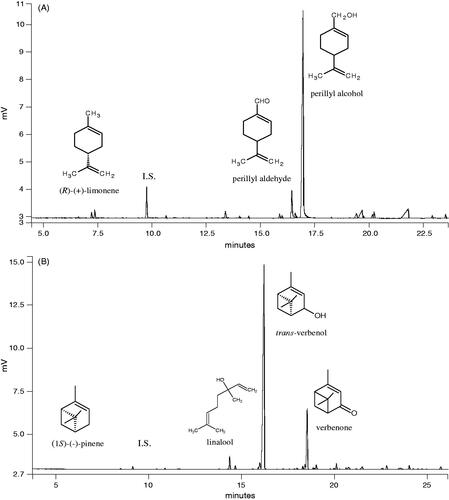
Figure 2. The effect of 24 h treatment of HT29 (A and C) and CCD 841 CoTr (B and D) cells with (R)-(+)-limonene and its derivatives. MTT assay (A and B) and Neutral Red assay (NR) (C and D). The results are presented as a percentage of the controls, arbitrarily set to 100%. The figure shows an average of three independent experiments.
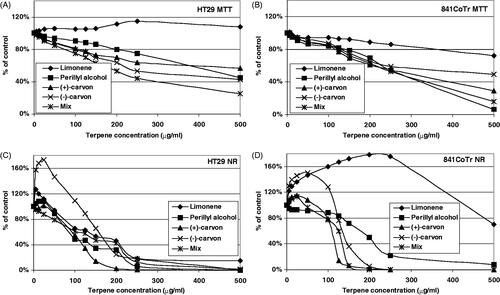
Figure 3. The effect of 24 h treatment of HT29 (A and C) and CCD 841 CoTr (B and D) cells with (−)-α-pinene and its derivatives. MTT assay (A and B) and Neutral Red assay (NR) (C and D). The results are presented as a percentage of the controls, arbitrarily set to 100%. The figure shows an average of three independent experiments.
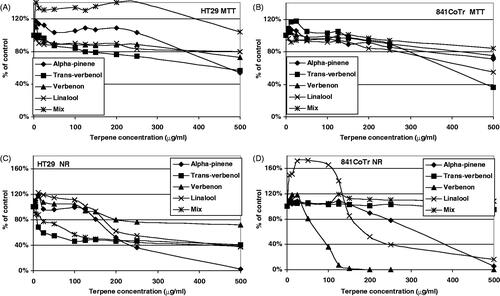
Figure 4. IL-6 secretion in culture of CCD 841 CoTr cells during 24 h incubation with (R)-(+)-limonene or (−)-α-pinene and their derivatives. ELISA test. *p ≤0.01 – a culture treated with terpenes compared with a non-treated control culture. #p ≤0.01 – a culture treated with terpenes compared with a non-treated control culture after pre-incubation with LPS.
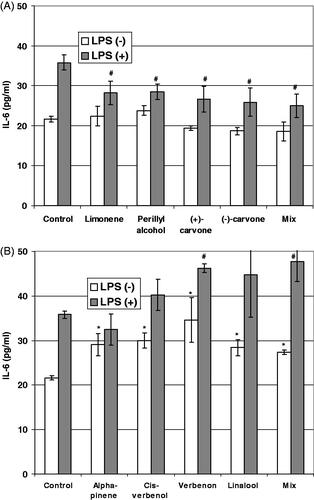
Table 1. Nitric oxide production by human colon tumor cell (HT29) and normal colonic epithelial cell (CCD 841 CoTr) after 24 h incubation with (R)-(+)-limonene and its derivatives.
Table 2. Nitric oxide production by human colon tumour cell (HT29) and normal colonic epithelial cell (CCD 841 CoTr) after 24 h incubation with (−)-α-pinene and its derivatives.
Table 3. IC50 values obtained after human colon tumour cell (HT29) and human normal colonic epithelial cell (CCD 841 CoTr) after 24 h incubation with (R)-(+)-limonene and (−)-α-pinene and their derivatives (MTT and Neutral Red analysis).