Figures & data
Figure 1. Structure of TEO (2α,-3α,-24-trihydroxyurs-12-en-28-oic acid).
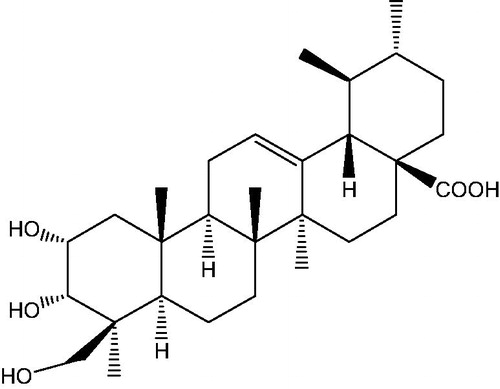
Figure 2. Effect of TEO on proliferation of BEL-7402, BEL-7404 and SMMC-7721 cell lines. The cells were cultured in 10% FCS medium and treated with TEO (1.25, 2.5, 5, 10, 20, 40 μg/mL) for 24 and 48 h. The experiments were conducted in triplicate and each value indicates the mean ± SD of five independent experiments. *p < 0.05 and **p < 0.01 compared with the control group.
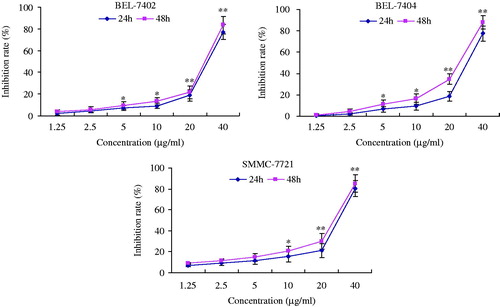
Figure 3. Cell cycle distribution of three HCC cell lines untreated and treated (40 μg/mL) with TEO for 24 h.
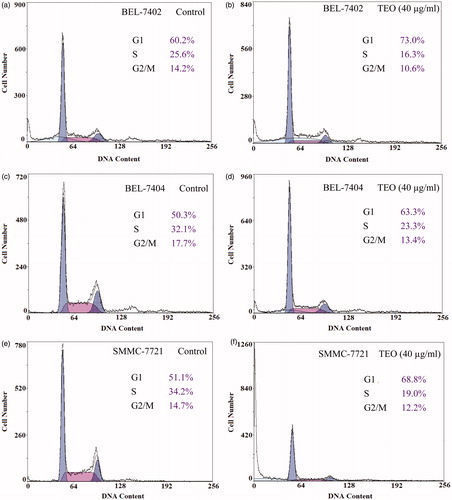
Figure 4. (a) Representative images of AO/EB stained BEL-7402 cells (200×, final magnification), BEL-7404 cells and SMMC-7721 cells (100×, final magnification). After TEO treatment, apoptotic cells (orange fluorescence) exhibited chromatin condensation and apoptotic bodies (arrows). (b) Representative images of DAPI stained three HCC cell lines (200×, final magnification). Arrows indicate nuclear condensation or fragmentation.
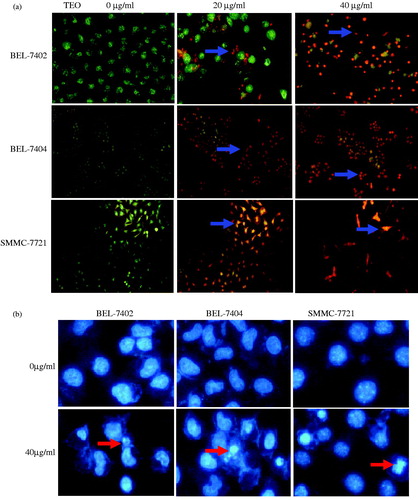
Figure 5. DNA damage effects of TEO (40 μg/mL) after 24 h treatment on three HCC cell lines were investigated by comet assay (a). These effects were represented as comet tail length (μm), comet length (μm), head DNA (%) and tail DNA (%) of BEL-7402 (b), BEL-7404 (c) and SMMC-7721 (d) cells. Data are expressed as mean ± SD. n=100. **p < 0.01 represents significant difference when compared with control group.
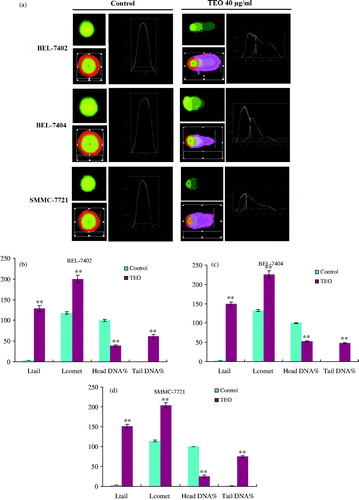
Figure 6. The levels of TNF-α as affected by TEO in treatment of three HCC cell lines. Values are expressed as mean ± SD of triplicate samples. *p < 0.05 and **p < 0.01 compared with control group.
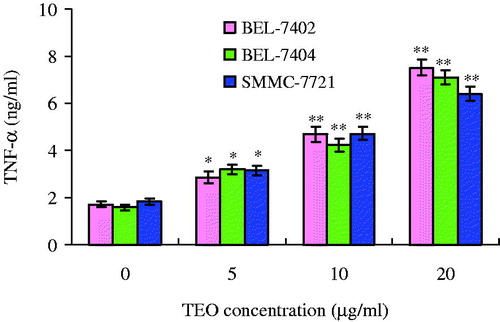
Figure 7. (a) MMP of HCC cell lines detected by JC-1 assay. The fluorescence images of JC-1 for cells (400×, final magnification). (b) TEM assay of structural damage (arrows) of mitochondria induced by TEO.
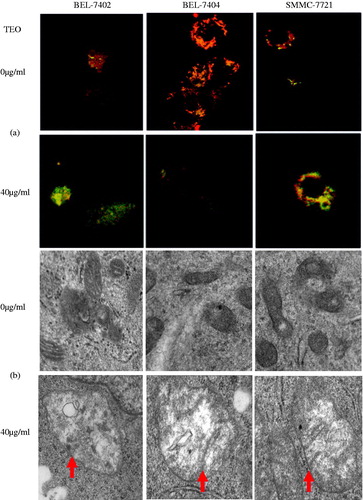
Figure 8. Expression levels of Bcl-2, Bax and Bid proteins in TEO-treated BEL-7402 (a), BEL-7404 (b) and SMMC-7721 (c) cell lines. (d–f) Bax/Bcl-2 ratios of three HCC cell lines. Data are representative of means ± SD from three independent experiments. *p < 0.05 and **p < 0.01 compared with control group.
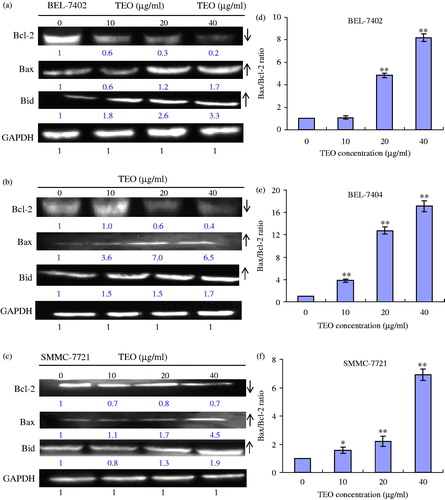
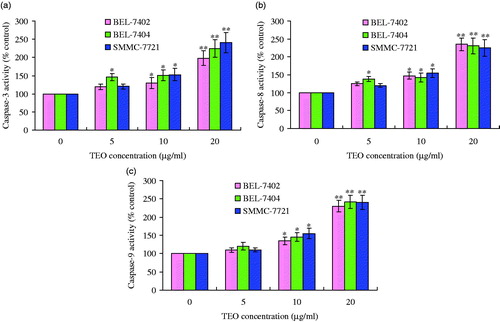
Figure 9. TEO-induced apoptosis is mediated by caspase activation: (a) caspase-3 activity; (b) caspase-8 activity; (c) caspase-9 activity. Values are expressed as mean ± SD of triplicate samples. *p < 0.05 and **p < 0.01 compared with control group.