Figures & data
Figure 1. Structure of the flavonoid baicalein and its methylated derivatives.
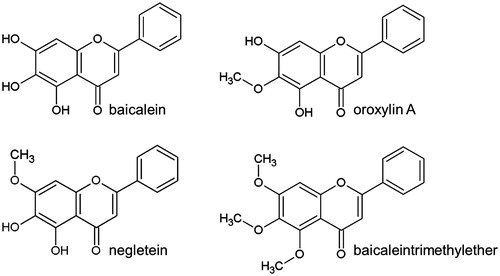
Figure 2. Modulation of the cellular proteasomal activity and ubiquitinylation of Nrf2 by baicalein. Cells were incubated with baicalein (40 μM) for 1 h or 4 h before adding protease-specific substrate probes for (A) chymotrypsin-like, (B) trypsin-like or (C) caspase-like proteasomal activity according to the protocol of the manufacturer. Data are mean ± SD, n = 3, *p <0.05, **p < 0.01 versus DMSO-treated control cells, MG132 (1 μM, 4 h) was used as positive control. (D) Total protein derived from Hct116 cells treated with baicalein (40 μM) for 4 h was subjected to immunoprecipitation (anti-Nrf2 antibody) and immunostaining (anti-Nrf2 antibody and anti-ubiquitin antibody). One representative blot of three is shown with essentially the same results.
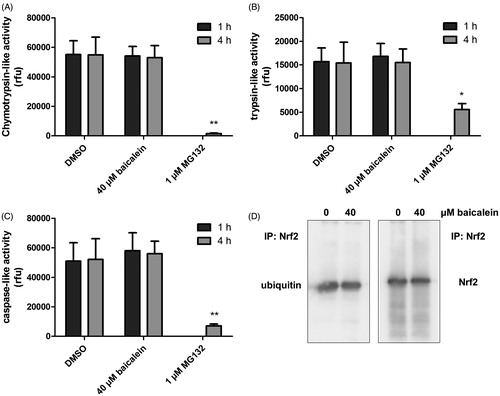
Figure 3. Phosphorylation of Nrf2 and NRF2 expression. (A) Impact of baicalein on NRF2 expression: RNA isolated from Hct116 cells incubated with 40 μM baicalein for various timespans was subjected to RT-PCR using nrf2 and gapdh primers. One representative agarose gel of three is shown. (B) Modulation of Nrf2 phosphorylation (Ser40): western blot analysis (anti-phospho-Nrf2 antibody) of Hct116 cells incubated with baicalein for 4 h. One representative blot of three and the corresponding anti-Nrf2 stained blot are shown. (C) Data are given as ratio phospho-Nrf2:Nrf2 after densitometric analysis. Data are mean ± SD, n = 3, *p < 0.05, **p < 0.01 versus DMSO-treated control cells.
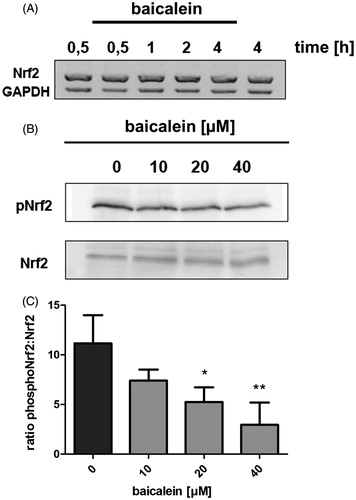
Figure 4. Antioxidative properties of the methylated baicalein derivatives. (A–C) The radical scavenging capacities were analysed in a cell free system (TEAC assay: detection of ABTS radical decolorisation, Trolox was used as positive control) and (D–F) in Hct116 cells: The intracellular ROS accumulation was measured using the fluorescent probe H2DCF-DA in cells treated with the compounds (4 h) followed by incubation with 500 μM H2O2 (1 h). DCF fluorescence as extent of oxidative stress was measured by flow cytometry (FL1-channel 530 ± 15 nm). Data are given as mean ± SD, n = 3, *p < 0.05, ***p < 0.001 versus the corresponding DMSO values.
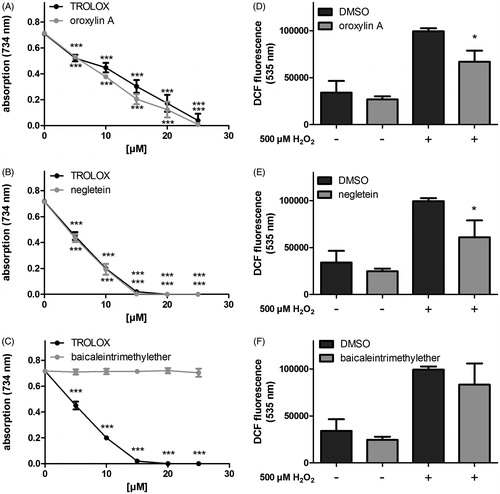
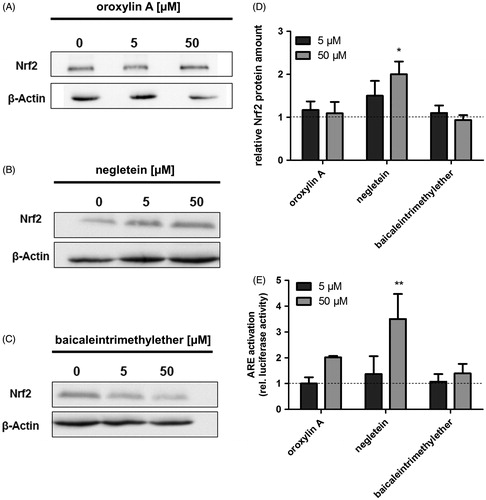
Figure 5. Effects of the baicalein derivatives on the cellular Nrf2 amount and ARE activation in Hct116 cells. Western blot analysis of Hct116 cells incubated with different concentrations of (A) oroxylin A, (B) negletein or (C) baicaleintrimethylether for 4 h. One representative blot of three is shown. Data are given as fold-increase of Nrf2 protein amount compared with the vehicle control (D). Mean ± SD, n = 3, *p <0.05 versus DMSO-treated control cells. (E) Modulation of ARE activation caused by the compounds: Hct116 cells were transfected with an ARE-luciferase construct followed by an incubation with the compounds (24 h). Luciferase activity as measure of ARE activation is shown, data are mean ± SD, n = 3, **p < 0.01 versus DMSO-treated control cells.