Figures & data
Figure 1. Structure and HPLC fingerprint of andrographolide isolated from Andrographis paniculata.
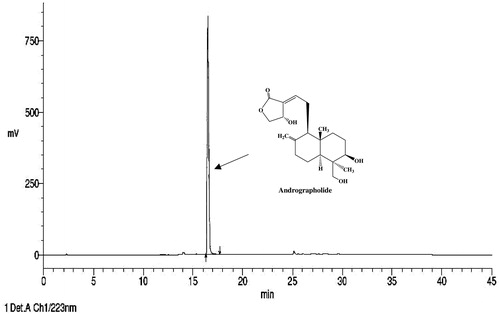
Figure 2. Summary of the experimental design used.
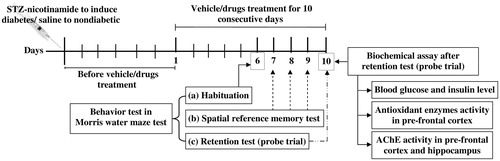
Figure 3. Effects of A. paniculata extract (AP), andrographolide (Andro), or piracetam on escape latencies to find the platform (on days 7–9) during Morris water maze test. Data are shown as the mean ± SEM (n=6). *p < 0.05 versus nondiabetic (ND) control; ¥p < 0.05 versus diabetic (D) control (two-way ANOVA followed by Bonferroni post tests).
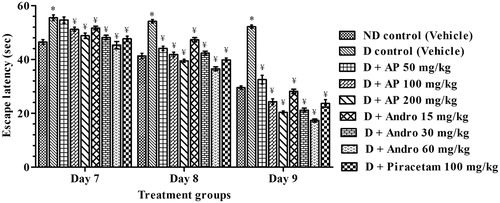
Figure 4. Effects of A. paniculata extract (AP), andrographolide (Andro), or piracetam on number of crossing (N) and time spent (s) in targeted quadrant (probe trial on day 10) during Morris water maze test. Data are shown as the mean ± SEM (n=6). *p<0.05 versus nondiabetic (ND) control; ¥p<0.05 versus diabetic (D) control (one-way ANOVA followed by Student–Newman–Keuls multiple comparison test).
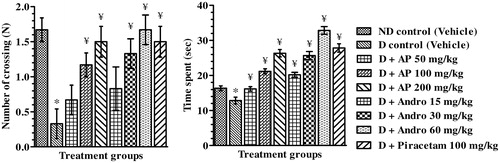
Figure 5. Effects of A. paniculata extract (AP), andrographolide (Andro), or piracetam on blood glucose and insulin level on day 10 after performing probe trial in Morris water maze test. Data are shown as the mean ± SEM (n=6). *p<0.05 versus nondiabetic (ND) control; ¥p<0.05 versus diabetic (D) control (one-way ANOVA followed by Student–Newman–Keuls multiple comparison test).
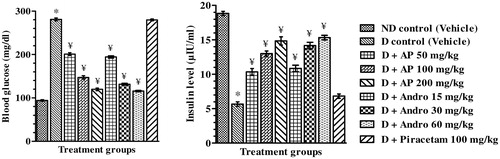
Figure 6. Effects of A. paniculata extract (AP), andrographolide (Andro), or piracetam on brain oxidative status, viz. LPO (nmol MDA/mg protein), SOD (unit/mg protein) and CAT (μmol H2O2/min/mg protein), assessed after completion of probe trial in Morris water maze test. Data are shown as the mean ± SEM (n=6). *p < 0.05 versus nondiabetic (ND) control; ¥p < 0.05 versus diabetic (D) control (one-way ANOVA followed by Student–Newman–Keuls multiple comparison test).
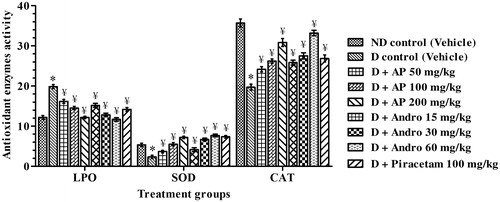
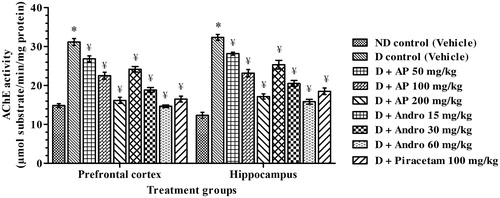
Figure 7. Effects of A. paniculata extract (AP), andrographolide (Andro) or piracetam on acetylcholinesterase enzyme activities in brain regions quantified after completion of probe trials in Morris water maze test. Data are shown as the mean ± SEM (n=6). *p < 0.05 versus nondiabetic (ND) control; ¥p < 0.05 versus diabetic (D) control (one-way ANOVA followed by Student–Newman–Keuls multiple comparison test).