
Figures & data
Figure 1. HPLC chromatograms of (A) the blank intestinal fluid, (B) the standard solution of verapamil and (C) the representative sample: (a) verapamil.
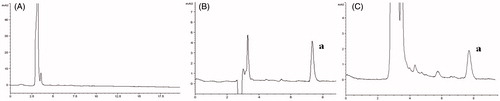
Table 1. IC50 values of the tested drugs in MTT assay (mean ± SD, n=3, a density of 5.0 × 10⁴ cells/well at 37 °C).
Figure 2. The image of flow cytometry. It indicated the effects of each experimental drug on the intracellular accumulation of Rh-123 at different concentrations.
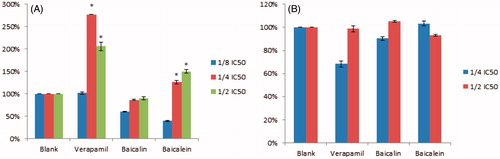
Figure 3. Intracellular accumulation of RH-123 (A) and FC (B) exposed to the tested drugs. Each data value was expressed as a percentage of the control, and was presented as the mean ± SD (n=3) (*p < 0.01).
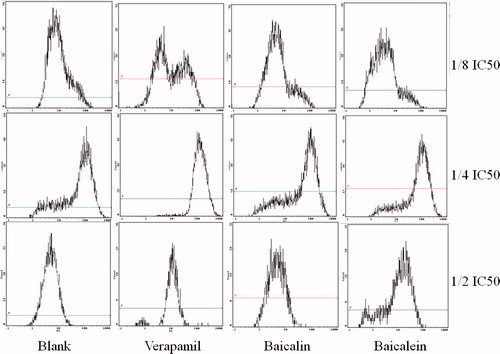
Figure 4. The image of flow cytometry. It showed the effects of the tested drugs on P-gp expression in Caco-2 cells at different concentrations.
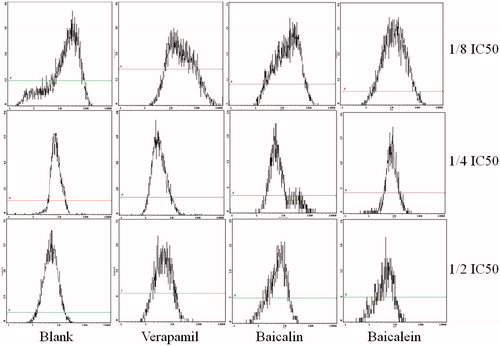
Figure 5. Flow cytometry analysis of P-gp expression levels in Caco-2 cells exposed to the tested drugs. Each value was expressed as a percentage of the control, and was presented as the mean ± SD (n=3). (*p < 0.01).
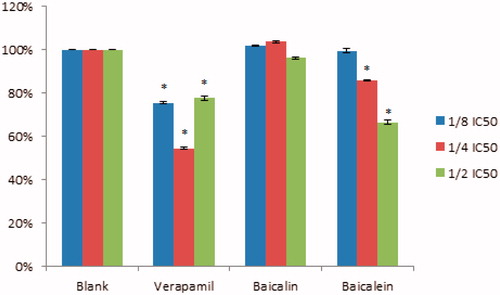
Figure 6. Transport of verapamil in rat gut sacs exposed to baicalin (A) and baicalein (B). Verapamil and baicalin (or baicalein) in various proportions (as shown in figure legends) were filled in rat gut sacs, and then incubated in 20 mL Tyrode’s solution for various time periods. Each data value was expressed as a percentage of the control, and was presented as the mean ± SD (n=3) (*p < 0.05).
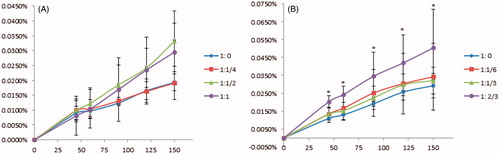
Figure 7. Chemical structures of (A) baicalin and (B) baicalein.
