
Figures & data
Figure 1. Effect of AMF on antioxidant parameters in NaF treated mice: (A) catalase, (B) SOD, (C) GSH and (D) lipid peroxidation. Values are mean ± SD, n=6. ***p<0.001, **p<0.01, *p<0.05 (Tukey test). Vehicle control group was compared with treated groups.
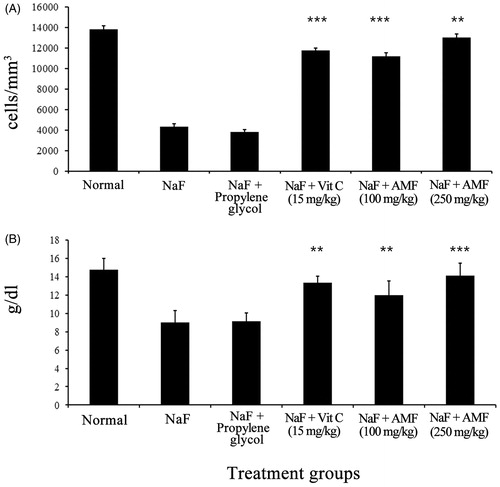
Figure 2. Effect of AMF on haematological parameters in NaF treated mice: (A) total WBC count and (B) haemoglobin level. Values are mean ± SD, n=6. ***p<0.001, **p<0.01, *p<0.05 (Tukey test). Vehicle control group was compared with treated groups.
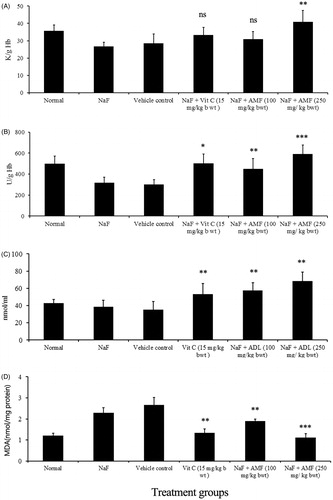
Table 1. Antimutagenic activity of AMF on mutagenicity induced by sodium azide in S. typhimurium strains TA 98, TA 100 and TA 102.
Table 2. Antimutagenic activity of AMF on mutagenicity induced by NPD in S. typhimurium strains TA 98, TA 100 and TA 102.
Figure 3. The effect of AMF in the formation of papilloma: (A)- control group (DMBA + croton oil alone) and (B) treated (DMBA + croton oil alone + 5% AMF).
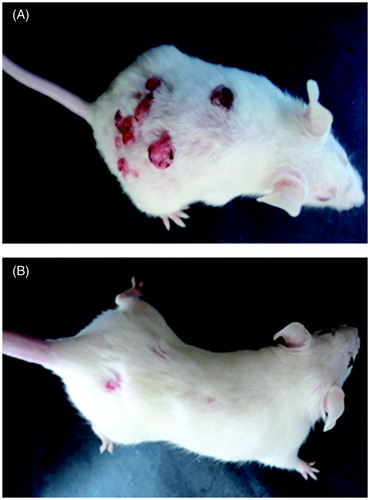
Figure 4. Effect of AMF on the number of papilloma in DMBA induced papillomas bearing mice. Control group indicates DMBA + croton oil alone. Dosage – single dose of DMBA (470 nmol/mouse) in 200 μL acetone. Croton oil (1%) in acetone (200 μL/animal) and 1%, 3% and 5% AMF in propylene glycol, twice in a week for 6 weeks. The number of papillomas per animals was recorded up to 20 weeks.
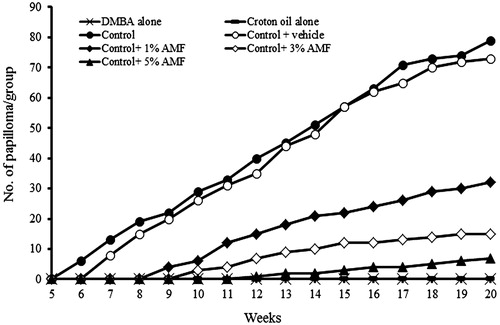
Figure 5. (A) The number of mice with papilloma/group, (B) the average number of papilloma developed/group and (C) the percentage inhibition of papilloma by AMF on DMBA induced papilloma bearing mice. Control group indicates DMBA + croton oil alone. DMBA alone and croton oil alone are not shown as they did not develop papilloma.
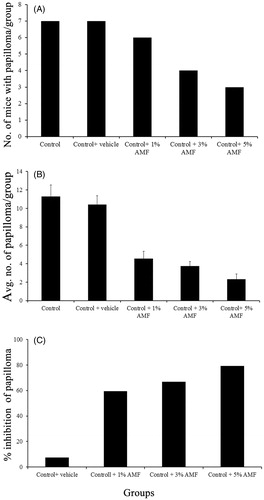
Figure 6. The GC–MS spectra of AMF.
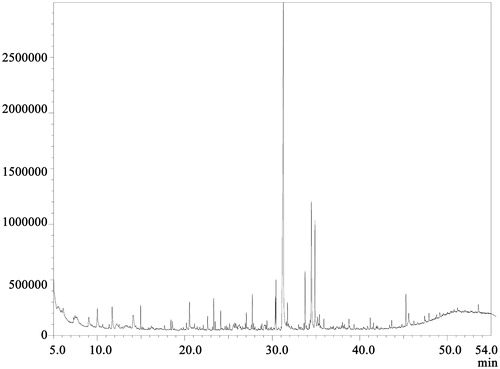
Table 3. The phytoconstituents identified by GC–MS analysis of AMF.
Table 4. The important phytoconstituents in GC–MS analysis of AMF.