Figures & data
Table 1. Effect of different compositions and DP of hydrolysed inulin on weight gain, feed intake, cecal weight and cecal pH in Sprague–Dawley rats.
Figure 1. Impact of inulin supplementation on Lactobacillus spp. (A), Bifidobacteria (B), Escherichia coli (C) and Salmonella spp. (D) load in cecal content of rats. Values are represented as mean ± SD. Bars with different alphabets represent the significant difference among the groups (p <0.05).
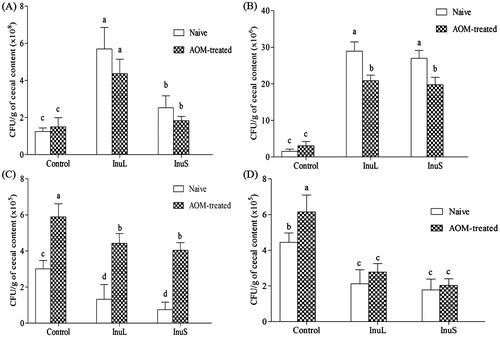
Figure 2. Analysis of organic acids in cecal content of rat. Values are represented as mean ± SD. Bars with different letters in each panel are significantly different (p <0.05). Butyric acid was not detected in the normal diet and the normal diet + AOM group.
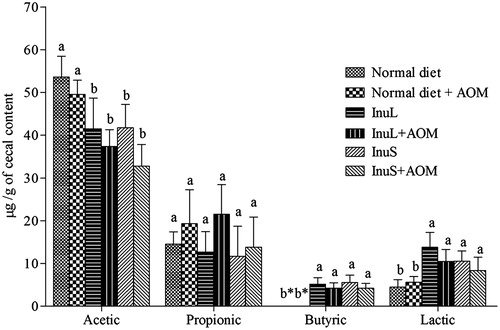
Figure 3. Production of putrefactive compounds in rat’s cecal contents. Values are the mean ± SD. Bars with different alphabets represent the significant difference among the groups (p < 0.05).
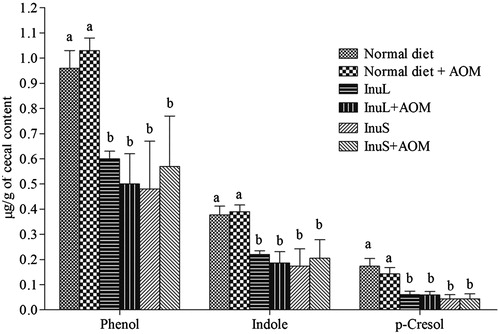
Table 2. Activity of microbial enzymes of rat cecal content.
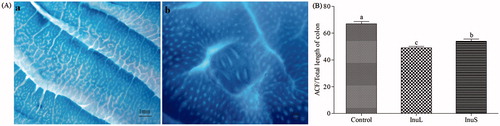
Figure 4. (A) Representative images showing colon of the naive (a) and the AOM-treated (b) rat stained with 0.2% methylene blue. (B) Aberrant crypt foci in colon of rats treated with AOM. Values are the mean ± SD. Bars with different alphabets represent the significant difference among the groups (p <0.05).