Figures & data
Figure 1. The representation of quantitative bar diagram of the cytokine levels in intestinal epithelial cells by ELISA without treatment of 6G (white colour bar) or with treatment of 6G (grey colour bar) post V. cholerae infection at different time points. Int 407 cells were treated with 6G and were stimulated with V. cholerae for 0, 2, 3, 3.5, 6 and 8 h and analysed by ELISA for IL-8, IL-6, IL-1 α and IL-1 β. The bar diagram represents data in mean ± SD of three independent experiments. The standard deviation is shown by the error bars (*, ** and *** represents level of significance at <0.05, <0.001 and <0.0001, respectively).
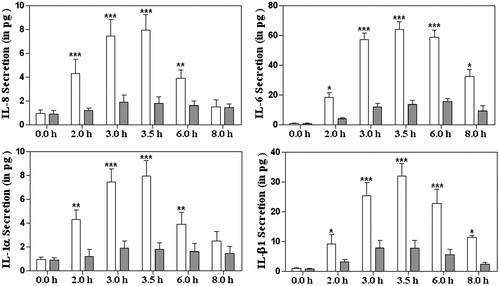
Figure 2. The representation and quantitification of cytokines levels at the mRNA levels in intestinal epithelial cells without treatment of 6G (white colour bar) or with treatment of 6G (grey colour bar) post V. cholerae infection at different time points. Int 407 cells were treated with 6G and were stimulated with V. cholerae for 0, 2, 3, 3.5, 6 and 8 h, mRNA extracted and RT-PCR was performed for IL-8, IL-6, IL-1 α and IL-1 β. The bar diagram represent data in mean ± SD of three independent experiments. The standard deviation is shown by the error bars (* and *** represents level of significance at <0.05 and <0.0001, respectively).
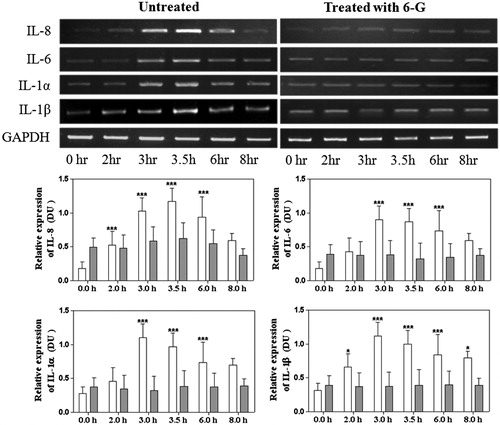
Figure 3. Effects of 6G on ERK, p38 MAP-kinase, Iκ-Bα activation and reduction of p-65 post V. cholerae infection in intestinal epithelial cells without treatment of 6G (white colour bar) or with treatment of 6G (grey colour bar) post V. cholerae infection at different time points. Int 407 cells were treated with 6G which were stimulated with V. cholerae for 0, 10, 15, 30, 60 and 90 min and samples were run on SDS-PAGE and proteins were blotted on PVDF membrane. The blots were probed with anti-phospho-ERK1/2 anti-phospho-p38 and normalisation of the p-ERK1/2 and p-p38 was carried out with non-phosphorylated ERK1/2 and p38, respectively. The blots were probed with anti-p65 and anti-IκBα (G&H) and normalisation of the p-65 and IκBα was carried out with β-actin. The bar diagram represent data in mean ± SD of three independent experiments. The standard deviation is shown by the error bars. ** and *** represents level of significance at <0.001 and <0.0001 respectively). Int 407 epithelial without treatment of 6G (white colour bar) or with treatment of 6G. [*] Denotes level of significance at < 0.05.
![Figure 3. Effects of 6G on ERK, p38 MAP-kinase, Iκ-Bα activation and reduction of p-65 post V. cholerae infection in intestinal epithelial cells without treatment of 6G (white colour bar) or with treatment of 6G (grey colour bar) post V. cholerae infection at different time points. Int 407 cells were treated with 6G which were stimulated with V. cholerae for 0, 10, 15, 30, 60 and 90 min and samples were run on SDS-PAGE and proteins were blotted on PVDF membrane. The blots were probed with anti-phospho-ERK1/2 anti-phospho-p38 and normalisation of the p-ERK1/2 and p-p38 was carried out with non-phosphorylated ERK1/2 and p38, respectively. The blots were probed with anti-p65 and anti-IκBα (G&H) and normalisation of the p-65 and IκBα was carried out with β-actin. The bar diagram represent data in mean ± SD of three independent experiments. The standard deviation is shown by the error bars. ** and *** represents level of significance at <0.001 and <0.0001 respectively). Int 407 epithelial without treatment of 6G (white colour bar) or with treatment of 6G. [*] Denotes level of significance at < 0.05.](/cms/asset/e5cedd98-e663-467e-9ad0-cb8c742fea4e/iphb_a_1110598_f0003_b.jpg)
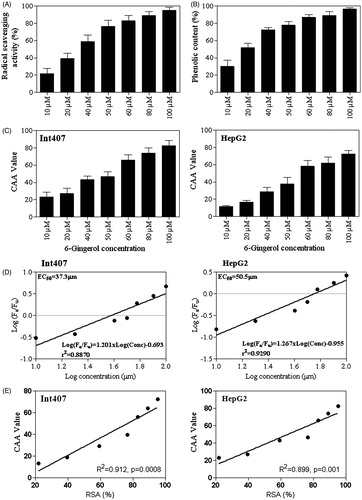
Figure 4. (A) Total anti-oxidant capacity of 6G at various concentrations (10–100 μM) by DPPH radical scavenging activity assay (RSA). (B) Total phenolic content of 6G at various concentrations (10–100 μM) by the Folin–Ciocalteu reagent against gallic acid equivalents. (C) The CAA value of 6G in Int407 and HepG2 cells treated with various concentrations (10–100 μM). (D) Median effect plots for inhibition of peroxyl radical-induced DCFH oxidation by 6G for Int407 and HepG2 cells. (E) The correlation between CCA and RSA (%) for Int407 and HepG2 cells was calculated by using spearman correlation test (R2, spearman coefficient and p-value with level of significance <0.05). The bar diagram represent data in mean ± SD of three independent experiments. The standard deviation is shown by the error bars.